Goals
Upon successful completion of this lab, you should be able to write and edit Python programs that use:
- if-statements and relational expressions
- logical operations and expressions
- if, if/elif, and if-else statements
- nested for-loops
Setup and Practice
Setup
- If your lab machine was not started in MacOS when you went to use it, get help to reboot it to MacOS.
- Follow these procedures to mount your blue home-directory on the local machine and create a PyCharm project (call it Lab03). You will use PyCharm in the next part, but, it is important that you set up your project now so that if you run into any issue, we can resolve them quickly.
Practice
As you work through this section, be sure that you really understand each of the programs, and call for help if you don't!
In a new browser tab, visit the online Python 3 tutor and enter the following Python code:
def main():
    x = 7
    if x < 0:
        print('negative')
    if x > 0:
        print('positive')


main()
Then click "Visualize execution."- Using the visualizer to help you if necessary, answer Questions 1 and 2 in your writeup. Try to answer the question without using the visualizer at first, and then use it if you get stuck.
Modify the if-statements as follows (changes are bold and highlighted):
if x < 0:
    print('negative')
else:
    print('non-negative')
Then click "Visualize execution."- Using the visualizer to help you if necessary, answer Questions 3 and 4 in your writeup. Try to answer the question without using the visualizer at first, and then use it if you get stuck.
- Next, try the following code:
def main(): num = 5 # TODO: change this value if num == 0: num += 2 print('Your value is now ', num, '.', sep="") else: num += 4 print('Your value is now ', num, '.', sep="") if num > 0: num -= 4 print('Your value is now ', num, '.', sep="") main() - Answer Question 5 in your writeup without running the program. Then run the program to check your answers.
Next, try the following revisions (changes are bold and highlighted):
if num == 0: num += 2 print('Your value is now ', num, '.', sep="") if num < 0: num += 4 print('Your value is now ', num, '.', sep="") else: num -= 4 print('Your value is now ', num, '.', sep="")- Answer Question 6 in your writeup.
Next, try the following revision (changes are bold and highlighted):
if num == 0: num += 2 print('Your value is now ', num, '.', sep="") elif num < 0: num += 4 print('Your value is now ', num, '.', sep="") if num > 0: num -= 4 print('Your value is now ', num, '.', sep="")- Answer Question 7 in your writeup.
Finally, link together your if-statements as follows (changes are bold and highlighted):
if num == 0: num += 2 print('Your value is now ', num, '.', sep="") elif num < 0: num += 4 print('Your value is now ', num, '.', sep="") else: num -= 4 print('Your value is now ', num, '.', sep="")- Answer Question 8 in your writeup.
Practice with Nested Loops. Enter the following code into the Online Python 3 Tutor:
line = 1
for i in range(1, 4):
    for j in range(1, 5):
        print('Line ', line, ': (', i, ', ', j, ')', sep="")
        line += 1
Try to predict what this loop will do. Answer Questions 9-12 in your writeup. Then use the tutor to step through this loop and check your work.
- Continue to Part A.
Part A: Locate the user's mouse clicks
As you work through this section, be sure that you really understand each of the programs, and call for help if you don't!
Instructions
Open PyCharm and then the project Lab03. Create a new python file and call it lab03a.py.
Copy-paste the following program into the new window, substituting your name for the italicized text:
"""
Program: CS 115 Lab 3a
Author: Your name here.
Description: This program uses the graphics package
    to interact with the user.
"""
from graphics import *


def main():
    window = GraphWin('Lab 3a_1', 400, 600)

    for i in range(5):
        click_point = window.getMouse()
        click_point_x = click_point.getX()
        click_point_y = click_point.getY()
        print('x = ', click_point_x, ', y = ', click_point_y, sep="")
    window.getMouse()
    window.close()

main()
Run the program and click the mouse in the window that it launches. After each click, look at the console (text) output. There, you will see the values of the x- and y-coordinates of the 5 points where the user clicked.
Some explanation:
- Recall that the following statement prompts the user for a name and
and then saves what the user types into a variable whose name is
user_inputand whose data type isstr:user_input = input('Enter a name: ')Similarly, the statement
click_point = window.getMouse()
waits for the user to click the mouse in the graphics window. Then, it saves the coordinates of the point where the mouse click occurred into a variable whose name is
click_pointand whose data type isPoint. - The
Pointobject that gets created as a result of the above code is similar to the following:center = Point(120, 110)
This code creates a
Pointvariable with x- and y-coordinates of 120 and 110.In the example of
window.getMouse(), Python uses the x and the y of the point the user clicked to createclick_point. - Once you have a variable whose data type is
Point, you can extract its x- and y-coordinates usingvariable_name.getX()andvariable_name.getY(), respectively.
- Recall that the following statement prompts the user for a name and
and then saves what the user types into a variable whose name is
Once you have understood these explanations, answer Question 13 in your writeup.
Modify the above program to draw a circle centered at the point of each mouse-click. Use 20 for the radius of the circle. At the end, you should see 5 circles in the graphics window for the 5 points the user clicked.
Hint: you may refer to your lab02 code or our tutorial to remember the syntax for creating circles.
Part B: Drawing Rectangles
You create a rectangle using two points, which serve as the upper-left and lower-right corners of the rectangle. We will practice this by drawing rectangles with all equal sides, also called squares.
Instructions
- Create a new Python program called lab03b.py.
Copy and paste the following program in lab03b.py.
"""
Program: CS 115 Lab 3b
Author: Your name here.
Description: This program draw a few rectangles and fills them.
"""
from graphics import *


def main():
    window = GraphWin('Lab 3a_2', 400, 600)

    palette_top_left_x = 10
    palette_top_left_y = 20
    width = 60
    height = 60
    yellow_top_left = Point(palette_top_left_x, palette_top_left_y)
    yellow_bottom_right = Point(palette_top_left_x + width, palette_top_left_y + height)
    yellow_rectangle = Rectangle(yellow_top_left, yellow_bottom_right)
    yellow_rectangle.setFill('yellow')
    yellow_rectangle.draw(window)

    for i in range(5):
        c_point = window.getMouse()
        x_c_point = c_point.getX()
        y_c_point = c_point.getY()
        if (yellow_top_left.getX() <= x_c_point <= yellow_bottom_right.getX() and
           yellow_top_left.getY() <= y_c_point <= yellow_bottom_right.getY()):
            print('The click with x =', c_point.getX(), 'and y =',
                  c_point.getY(), 'is in the yellow square.')
        else:
            print('The click with x =', c_point.getX(), 'and y =',
                  c_point.getY(), 'is not in the yellow square.')

    window.getMouse()
    window.close()

main()
The program draws a square (a rectangle) and then fills it with yellow color. Then, it enters a loop.
- Read the code for the loop, and answer Questions 14 through 17 in your writeup.
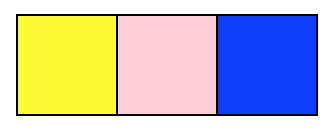
Modify your program, to make it draw two additional squares and color them pink and blue, like the following image. Use helpful variable names so that you can easily distinguish the different squares.
After adding the new squares, modify your program to add extra conditional logic, so that if the user clicks on any of the squares, you can identify and print the square's color. The output of your program should be like this:
The click with x = 41 and y = 50 is in the yellow square.
The click with x = 261 and y = 239 is not in any of the squares.
The click with x = 48 and y = 40 is in the yellow square.
The click with x = 132 and y = 46 is in the blue square.
The click with x = 230 and y = 55 is not in any of the squares.
The click with x = 106 and y = 103 is not in any of the squares.
The click with x = 88 and y = 44 is in the pink square.
The click with x = 33 and y = 41 is in the yellow square.
The click with x = 6 and y = 36 is not in any of the squares.
The click with x = 53 and y = 10 is not in any of the squares.
Demo. When you are done, demo your code.
- Now, continue to Part C.
Part C: Draw a grid of colored squares
You will write a program to print a two-dimensional table where each of the table cells contains a random color. Then, you will accept user clicks and determine in which cell the click took place.
Instructions
Create a new Python file named lab03c_1.py:
"""
Program: CS 115 Lab 3c_1
Author: Your name here.
Description: This program draws a few rectangles and fills them.
"""
from graphics import *
from random import seed, randint


def random_color():
    '''Produces a random color.

    Returns:
        str: a string representing a color.
    '''
    # Note: Don't worry about the details of this function right now.
    colors = ['blue', 'blue2', 'blue3', 'green', 'green2', 'green3',
              'orange', 'orange2', 'orange3', 'red', 'red2', 'red3',
              'purple', 'purple2', 'purple3', 'yellow', 'yellow2', 'yellow3',
              'gray', 'gray2', 'gray3', 'pink', 'pink1', 'pink2', 'pink3']
    return colors[randint(0, len(colors)-1)]


def main():
    seed()  # Initialize random number generator

    top_left_x = 100
    top_left_y = 100
    width = 60
    height = 60
    # num_rows = int(input('Number of rows: '))  # commented out for now
    num_columns = int(input('Number of columns: '))

    window = GraphWin('Lab 3B', 800, 800)
    top_left_point = Point(top_left_x, top_left_y)
    bottom_right_point = Point(top_left_x + width, top_left_y + height)
    enclosing_rectangle = Rectangle(top_left_point, bottom_right_point)
    enclosing_rectangle.setFill(random_color())
    enclosing_rectangle.draw(window)

    window.getMouse()
    window.close()

main()
A few notes about this program.
- When you run this program, it will prompt the user for a value in the console (text) window, and then it will draw a graphical window.
- We have imported another module: random. Python, out of the box, comes with many useful modules. For example, we use the random module to generate random numbers (and subsequently, random colors). At this point, you just need to use these modules and not worry about the details of the functions that they provide.
- We have defined a function named
random_color(). Inside of yourmain()function, you can userandom_color()(instead of a string, like'blue') to get a randomly selected color from the list that is inside the definition ofrandom_color(). If you run this program multiple times, you will see that each time the squares that it draws are filled with different colors. - Recall that in Part B, we used the x- and y-coordinates of the top-left point to calculate the x- and y-coordinates of the bottom-right point. Specifically, if the top-left point of the square is (
Point(top_left_x, top_left_y)) and then the bottom-right point of the square is (Point(top_left_x + width, top_left_y + height)).
When you have read this code, answer Question 18 in your writeup.
Drawing a row of squares
Extend the above program so that it prints a row of squares, each of which is filled with a random color like the following image (see instructions below). In this example, the user has entered 10 for the number of columns.

Here are step by step instructions (a.k.a. pseudocode) for drawing this row of squares. You should translate these instructions to code inside your
main()functions.for i in range(num_columns): # Calculate x-coordinate of the top left point of the current square. # For example: # When i is zero (the first time through the loop), x should be top_left_x. # When i is 1, x should be top_left_x + width. # When i is 2, x should be top_left_x + 2 * width # etc. x = # TODO: equation based on top_left_x, width, and i # Calculate the y-coordinate of the top left point of the current square. # For example: # When y is zero, the value should be top_left_y. # Hint: Be careful! You may want to draw on a piece of paper. y = # TODO: equation based on top_left_y top_left_point = Point(x, y) bottom_right_point = Point(x + width, y + height) # Create a square using top_left_point and bottom_right_point # TODO: your code here (see prior code for example) # Fill the square with a random color # TODO: your code here (see prior code for example) # Draw the square in the window # TODO: your code here (see prior code for example)Read this algorithm carefully. Test your code multiple times, and be sure it draws a row of randomly colored squares each time. The number of squares in the row should be the number specified by the user.
Drawing a grid of squares with color
Create a new Python file called lab03c_2.py and copy and paste your previous solution into it. This will be the starting point for this part of your lab.
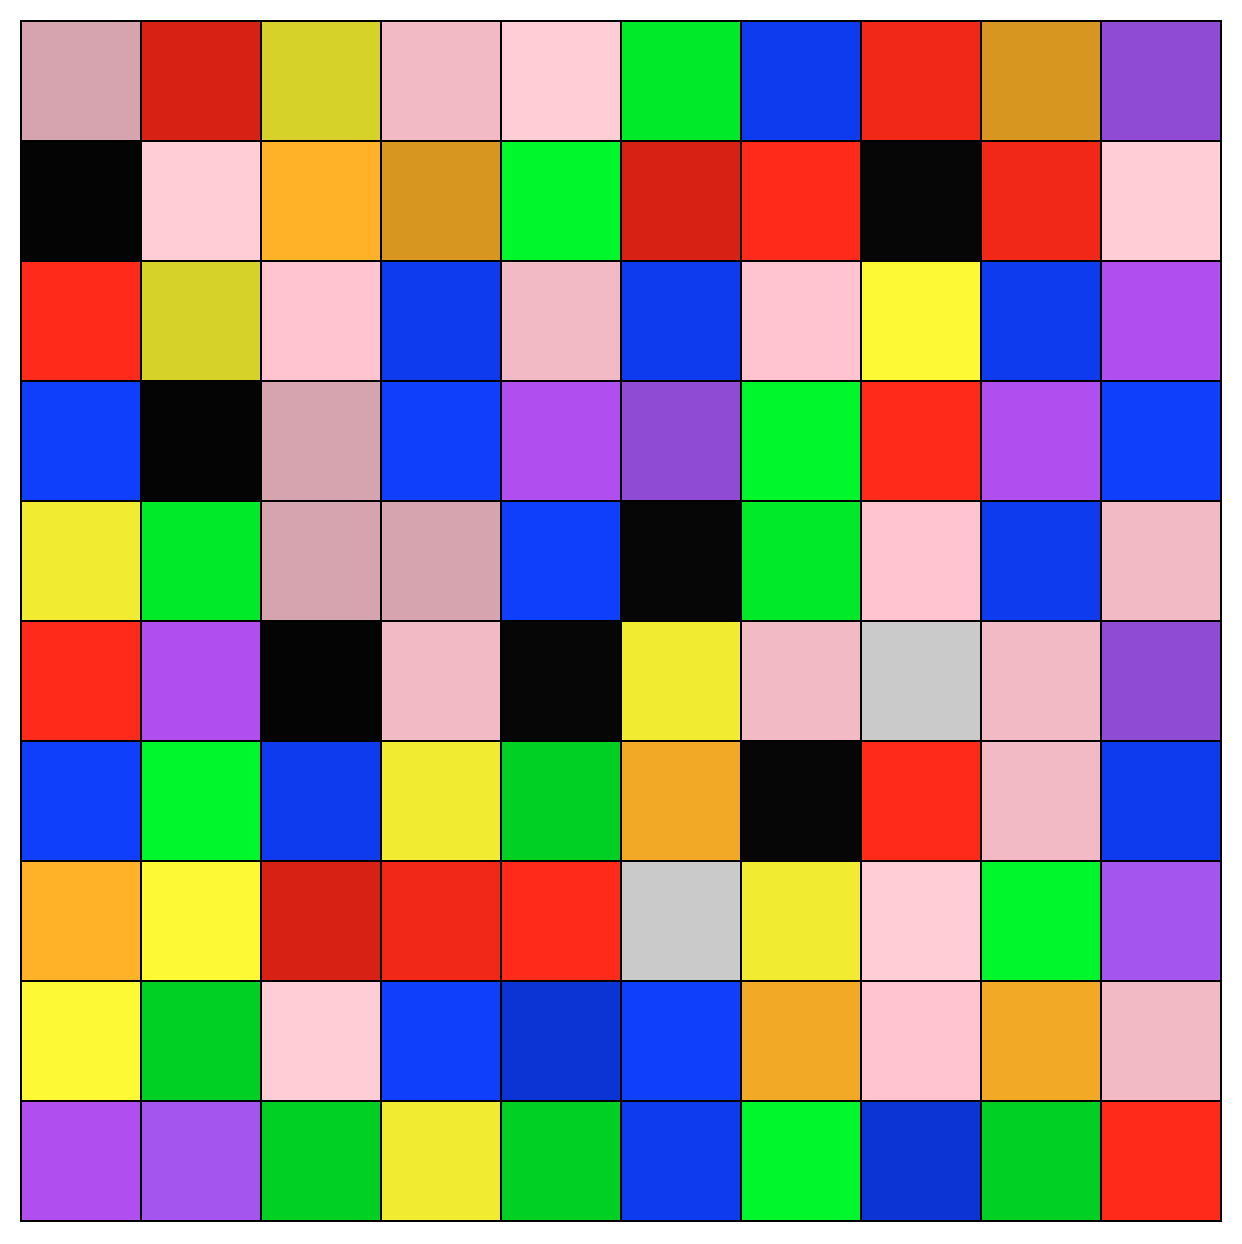
In this part, you will add the necessary code to your program to print the following grid.
Remove the
#from the beginning of the line starting withnum_rows. Now your program should prompt the user for two values (rows and columns) before opening the graphical window.Here is pseudocode for drawing the grid. It uses nested for-loops. Most of the missing logic for the inner-loop can be copied from your previous program.
for r in range(num_rows):
       # For each row, set the y-value of the top-left point of the ROW.
       #   For example:
       #   When r is 0, y should be top_left_y.
       #   When r is 1 (the second time through the loop), y is top_left_y + height.
       #   When r is 2, y is top_left_y + 2 * height
       #   When r is 3, it is top_left_y + 3 * height...
       y = # TODO: equation based on top_left_y, height, and r

       for c in range(num_columns):
           # Calculate x-coordinate of the top left point of the current square.
           x = # TODO: calculate this

           top_left_point = Point(x, y)
           bottom_right_point = Point(x + width, y + height)

           # Create a square using top_left_point and bottom_right_point
           # TODO: your code here

           # Fill the square with a random color
           # TODO: your code here

           # Draw the square in the window
           # TODO: your code here
The idea is that drawing a grid is just drawing row, after row, after row: our code loops over the "draw a row" logic (which is itself a for-loop).
Test your code multiple times, and be sure it draws a grid of randomly colored squares each time. The number of squares in each row and column should be the numbers specified by the user.
Demo. Once you are done, demo your code.
- Continue to Part D.
Part D: Characterize the user's mouse clicks
In this part of the lab, you will modify the program that you wrote for Part C so that you can accept the user's mouse-clicks and determine in which row and column each click occurred. If a mouse-click happens to be outside of the grid, your program will report that as well.
Instructions
Create a new Python program and call it lab03d.py. Copy and paste your previous program (lab03c_2.py) into it.
Add the following loop toward the end of your program, before the
window.getMouse()line.for i in range(10): c_point = window.getMouse() x_c_point = c_point.getX() y_c_point = c_point.getY() print('x =', x_c_point, 'y =', y_c_point)The idea is to, just as in Part A of this lab, accept the user's mouse-clicks and determine where they occur. In this part, if the mouse-click occurs in one of the num_rows * num_columns squares, we want to identify its row- and column-number (where the number of the first row and column is 1).
Remember that the top left of the grid begins at (100, 100).
Let's suppose that when you run your program and click the mouse, the x and the y of a mouse-click takes place at (235, 540). That is, x = 235 and y = 540. Here's a procedure you might follow:
- To get the row: subtract
top_left_yfrom 540 (the y-coordinate of the user's click) to get 440. So the click must have been 440 pixels below the top of the first row. - Divide 440 by the height of the square to get 7 (using integer division). This means the row number must be 8, since for a click to take place in row 8, its y has to be larger than or equal to 7 * 60 = 420 and less than 8 * 60 = 480.
- To get the column number, subtract
top_left_xfrom 235 to get 135. Given that top_left_x was 100, 235 - 100 = 135 is the x of the mouse-click measured from the left edge of the first column. - Since 135 // 60 = 2, the column number where the click occurred must have been 3.
- Therefore, the mouse was clicked in row 8, column 3.
- To get the row: subtract
Answer Question 19 in your writeup, to practice reasoning through this calculation.
Calculate (row,column) coordinates from an (x,y) point
Now, modify your program so that it accepts 10 user clicks and identifies the row and the column in which each click occurred. If the click occurs outside of the grid, your program should indicate so. Sample output of your program should look like this for a 10x10 grid:
The click at (364, 195) is in row 2, column 5.
The click at (388, 48) is outside of the grid.
The click at (186, 481) is in row 7, column 2.
The click at (60, 472) is outside of the grid.
The click at (431, 366) is in row 5, column 6.
The click at (617, 248) is in row 3, column 9.
The click at (520, 765) is outside of the grid.
The click at (670, 484) is in row 7, column 10.
The click at (253, 430) is in row 6, column 3.
The click at (132, 444) is in row 6, column 1.
- Demo. Stop here and demo your solution.
Be sure your docstring is up to date with your name and a current description of your program.
- Continue to the next part to submit your program.
Assignment Submission
Instructions
- Answer the last question (#20) in your Moodle writeup. Review your answers, and then click the "Next" button at the bottom of the quiz. Once you do that, you should see a "Summary of Attempt" screen.
- Click the "Submit all and finish" button. Warning: You must hit "Submit all and finish" so that your writeup can be graded! It is not submitted until you do this.
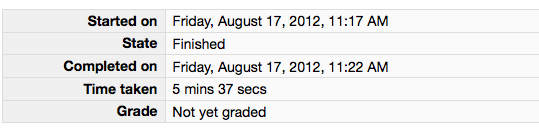
Once you have submitted your quiz, you should see something similar to this at the top of your Moodle window. The important part is that the State shows up as Finished.
Please leave this tab open in your browser. - Click on the "Lab 3 code" link in Moodle and open in a new tab. Follow the instructions to upload your source code (lab03d.py) for Lab03. You could either browse for your code or, using a finder window, drag and drop your lab03d.py from your cs115/Lab03 folder to Moodle. You should subsequently see a dialog box which indicates 'Submission Status' as 'Submitted for grading'.
- With these confirmation pages open in your browser, you may call an instructor over to verify that you have completed every part of the lab. Otherwise, you are done!