Goals
Upon successful completion of this lab, you will be able to write and edit Python program that plots a graph through the use of:
- for-loop, nested-if statements
- careful manipulation of variables
- Graphical objects such as Point, Line and Circle
Setup and Practice
Setup
- If your lab machine was not started in MacOS when you went to use it, reboot it to MacOS.
- Follow these procedures to mount your blue home-directory on the local machine and create a PyCharm project (call it Lab04). You will use PyCharm in the next part, but, it is important that you set up your project now so that if you run into any issue, we can resolve them quickly.
- Download the files points.txt and points-test.txt. Put them in the directory Lab04 you just created in step 2 above.
Practice
Nested loop practice
Try to predict what the following program will do, and answer Questions 1-3 in Moodle:for i in range(1, 4): for j in range(0, i): # The parameter end="\t" makes the print statement end with # a tab, rather than a newline ending (the default) print(i, ',', j, sep="", end="\t") print() # Prints a blank line or ends the current line- Afterwards, enter the code into the Online Python 3 Tutor and run it, to check your answers.
Lab preview
In Lab 4, you will solve a problem involving points in the Cartesian coordinate system. This is the one you are most familiar with from math courses, and differnet from the coordinate system used by the graphics library.
Consider the graph below:
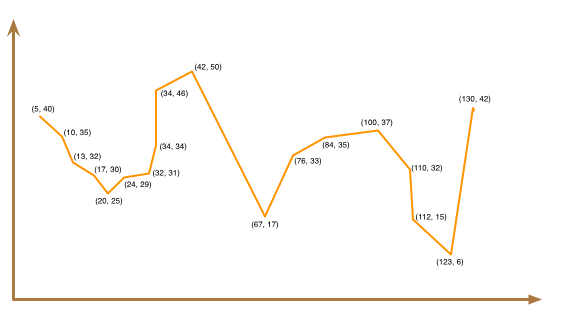
As you move from left to right along the horizontal (x) axis, the y-values fluctuate. For example, you might see a series of y-values that are increasing and then decreasing, and then increasing again, and then decreasing again, etc.
Your eventual job will be to read a sequence of numbers that represent the y-coordinates of consecutive points. Your program will identify the peaks and valleys in the graph represented by these points. You will see a precise definition of peaks and valleys shortly.
Note: throughout the lab, you are allowed to assume that two consecutive points will always have different values.
To gain more insight into peaks and valleys, consider the graph below, which has colored the peaks in black and the valleys in blue:
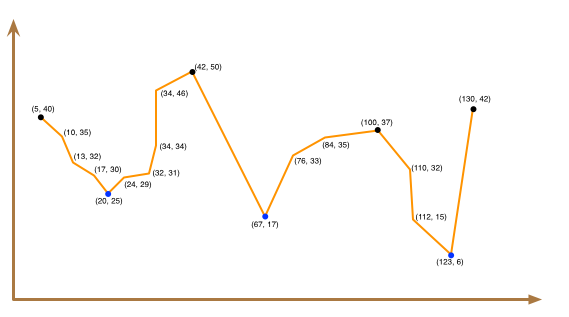
You would want your program to identify 4 peaks and 3 valleys for this dataset.
- Definition of peak
-
A peak is a point in the graph whose y-value is larger than the y-values of both of its immediate neighbors.
For example, point (42, 50) is a peak because its y-value (50) is greater than its left neighbor's y-value (46) and its right neighbor's y-value (17).
If a point only has one neighbor, we will consider it a peak as long as its y-value is larger than its neighbor's y-value. In the sample graph, the first point is a peak because its y-value (40) is greater than its only neighbor's y-value (35). The last point is also a peak because its y-value (42) is greater than its only neighbor's y-value (6).
- Definition of valley
-
The definition of valley is similar: a point is a valley point if its y-value is smaller than the y-values of both of its immediate neighbors.
For example, point (20, 25) is a valley because its y-value (25) is smaller than its left neighbor's y-value (30) and its right neighbor's y-value (29).
Similarly, the first point is a valley if its y-value is smaller than that of the second point. The last point is a valley if its y-value is smaller than that of the second-to-last point.
To get some practice with peaks and valleys, consider the following dataset. This dataset represents the y-values of 20 consecutive points:
14
6
9
28
13
22
4
11
42
18
45
10
14
8
49
42
40
6
8
47
Sketch these points on a piece of paper, and answer Question 4 in Moodle.
- After you have answered the question, begin Part A.
Part A: Print points
This part gives you a program to read a set of points, just like the type you explored in the Setup and Practice section.
Instructions
- Create a new Python source code file named lab04a.py:
""" Program: CS 115 Lab 4a Author: Your name Description: This program reads a bunch of y-values from a file. """ def main(): # Opens the input file - you don't have to understand this line yet pointsfile = open("points-test.txt", "r") # Reads and prints the first line of the input file num_points = int(pointsfile.readline()) print('Number of points:', num_points) # Reads and prints the points for i in range(0, num_points): y = int(pointsfile.readline()) print('Point ', i + 1, ': ', y, sep="") pointsfile.close() # Closes the input file after reading it main() - Read and try to understand the above program.
Some of the functions it uses are new to us, but you may be able to guess the behavior from context. The program simply reads and prints the set of points. Since it would be tiresome to enter these points one at a time, we are reading them from one of the text files you downloaded (points-test.txt). The format of this file is: the first line is the number of points to read, and the remaining lines are the y-values of the different points.
- Run this program, and answer Question 5 in your writeup. Call for help if the program crashes because it can't find the input file.
- Continue to Part B.
Part B: Draw a graph
In this part of the lab, you'll draw a line graph connecting the points that you read in. To draw the graph, you will first draw a line segment between the first two points. Then, you'll draw a line between the second and third, the third and fourth, etc.
Drawing a line
To draw a line segment using the graphics library, you need to provide its two endpoints. Then, you can color and draw the line just like you did with rectangles and circles. For example:
line = Line(Point(0, 0), Point(50, 50))  # Line from (0, 0) to (50, 50)
line.setOutline('orange')  # Color the line orange
line.draw(window)  # Draw it in the window
Drawing the rest
There are two issues to be aware of:
- The file contains a list of y-coordinates only. For the x-coordinates, you will put the first point at x=20, the second at x=30, the third at x=40, etc.
We have to be careful when plotting the y-coordinates. The points in the input file are based on the Cartesian coordinate system that you're used to. In this system, the origin is at the lower left, and points with larger y-values appear toward the top of the graph. In the graphics coordinate system, the origin is at the upper left, and points with larger y-values appear lower on the graph.
In order to make our graph look like a normal Cartesian graph, you will use window_height - y as the y-coordinate of each point when we draw it.
Instructions
Answer Question 6 in your writeup. You will need to look back at your output from Part A or look at points-test.txt to to answer this question.
- Create a new Python source code file named lab04b.py:
""" Program: CS 115 Lab 4b Author: Your name Description: This program draws a line graph. """ from graphics import * def main(): window_height = 600 window = GraphWin('Graph', 800, window_height) # Open the input file and read the number of points pointsfile = open("points-test.txt", "r") num_points = int(pointsfile.readline()) # ---- Draw a line between the first and second points x = 20 # see note above first_y = int(pointsfile.readline()) # get the first y-coordinate first_point = Point(x, window_height - first_y) # see note above second_y = int(pointsfile.readline()) # get the second y-coordinate x = x + 10 second_point = Point(x, window_height - second_y) # Draw a line between the first two points line = Line(first_point, second_point) line.setOutline('orange') line.draw(window) # Draw a circle centered at the first point circle = Circle(first_point, 1) circle.draw(window) #### Line A (for writeup) # ---- Draw a line between the second and third points first_point = second_point # the first point of the second line second_y = int(pointsfile.readline()) # read the third point x = x + 10 second_point = Point(x, window_height - second_y) # Draw the next line line = Line(first_point, second_point) line.setOutline('orange') line.draw(window) # Draw the second point circle = Circle(first_point, 1) circle.draw(window) #### Line B (for writeup) # ---- Draw a line between the third and fourth points first_point = second_point second_y = int(pointsfile.readline()) # read the third point x = x + 10 second_point = Point(x, window_height - second_y) line = Line(first_point, second_point) line.setOutline('orange') line.draw(window) # Draw the third point circle = Circle(first_point, 1) circle.draw(window) # Draw the fourth point circle = Circle(second_point, 1) circle.draw(window) #### Line C (for writeup) window.getMouse() window.close() main() - Read through the code very carefully. Notice that the endpoints of each of the lines that we have drawn are called
first_pointandsecond_point. In addition, the second point of the first line becomes the first point of the second line. The second point of the second line becomes the first point of the third line. That is why after having drawn the first line, we do the following in preparation for drawing the second line:first_point = second_point
We do the same after having drawn the second line in preparation for drawing the third line. - Answer Question 7 in your writeup. You will need to look back at your output from Part A or look at points-test.txt to to answer this question.
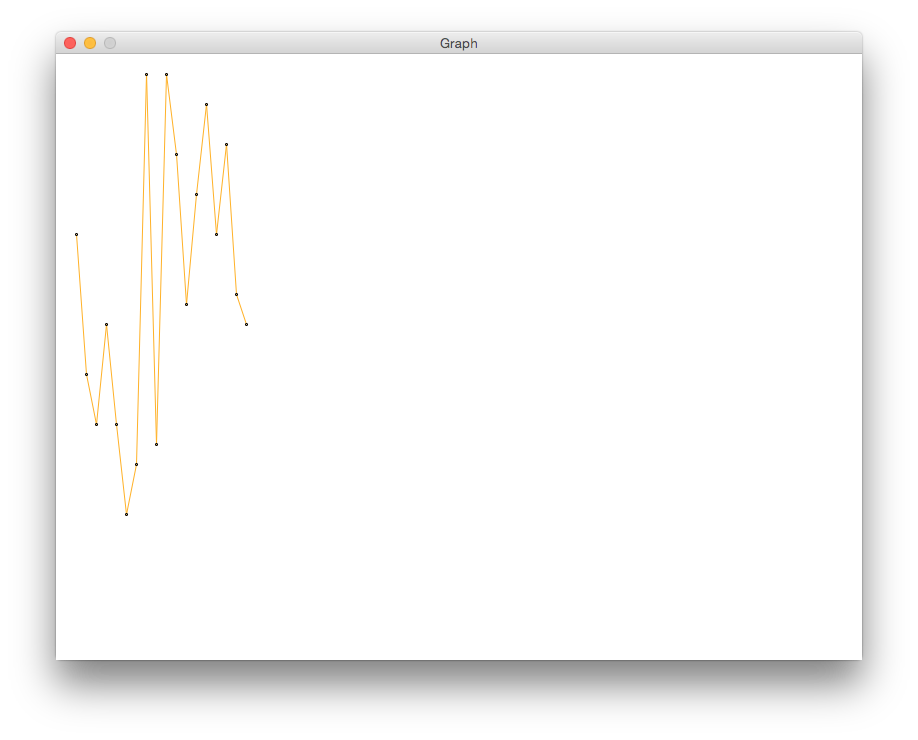
- We know that we have many lines of this type to draw. Therefore, we will use a loop for this
purpose. The question is how do we set up this loop? Here is an incomplete main function for it:
def main():
    window_height = 600
    window = GraphWin('Graph', 800, window_height)

    # Open the input file and read the number of points
    pointsfile = open("points-test.txt", "r")
    num_points = int(pointsfile.readline())

    x = 20
    first_y = int(pointsfile.readline())   # get the first y-coordinate
    first_point = Point(x, window_height - first_y)

    # We already have the first point, so start with 1.
    for i in range(1, num_points):
        # Read the next point and update x
        second_y = int(pointsfile.readline())
        x += 10
        second_point = Point(x, window_height - second_y)

        # TODO: Complete the code
        # draw the line between first_point and second_point.
        # draw a circle centered at first_point


        # use the second point of this line as the first point for the next
        first_point = second_point

    # TODO: Complete the code
    # draw a circle centered at first_point
    #   (Why? Didn't we already do this? It is for the last point.)


    window.getMouse()
    window.close()
Complete the code to draw the graph that is represented by all the points. The graph should be similar to the following image:
- Demo. Demo your code for a lab instructor.
- Continue to Part C.
Part C: Compare consecutive points
In order for us to find the peaks and the valleys of this graph, we first will have to determine if the consecutive points in the sequence are increasing or decreasing. Once we have this information, we can find out if the graph is turning (and creating a peak or valley).
Suppose we have the following three consecutive y-values:
20
30
15
When we see y=20 followed by y=30, we know that the y-coordinate has increased. With that information, when we see y=15, we can tell that the graph is turning. That is, the second point is a valley. You will learn more about that later.
For now, after having seen y=20 followed by y=30, we want to print a statement to indicate that the graph is increasing. When we see y=15, we want to print a statement to specify that the graph is decreasing.
We will base the "increasing" or "decreasing" on the original Cartesian coordinates, not the ones we used to draw the graph.
Instructions
- Create a new Python source code file named lab04c.py:
""" Program: CS 115 Lab 4c Author: Your name Description: This program draws a graph and determines whether consecutive points are increasing or decreasing. """ from graphics import * def main(): window_height = 600 window = GraphWin('Graph', 800, window_height) # Open the input file and read the number of points pointsfile = open("points-test.txt", "r") num_points = int(pointsfile.readline()) x = 20 first_y = int(pointsfile.readline()) # get the first y-coordinate first_point = Point(x, window_height - first_y) for i in range(1, num_points): # we got the first point already # so the range starts with 1 # Read the next point and update x second_y = int(pointsfile.readline()) x += 10 second_point = Point(x, window_height - second_y) # TODO: Print first_y and second_y # TODO: Complete this if-statement if (the second_y is larger than first_y): # the graph is increasing else: # the graph is decreasing # TODO: Should be the same code from Part B # draw the line between first_point and second_point # draw a circle centered at first_point # second_point becomes the first point of the next line first_y = second_y first_point = second_point # TODO: Should be the same code from Part B # draw a circle centered at first_point window.getMouse() window.close() main() - Complete this code so that it produces the following output:
y of first point = 420, y of second point = 280
decreasing
y of first point = 280, y of second point = 230
decreasing
y of first point = 230, y of second point = 330
increasing
y of first point = 330, y of second point = 230
decreasing
y of first point = 230, y of second point = 140
decreasing
y of first point = 140, y of second point = 190
increasing
y of first point = 190, y of second point = 580
increasing
y of first point = 580, y of second point = 210
decreasing
y of first point = 210, y of second point = 580
increasing
y of first point = 580, y of second point = 500
decreasing
y of first point = 500, y of second point = 350
decreasing
y of first point = 350, y of second point = 460
increasing
y of first point = 460, y of second point = 550
increasing
y of first point = 550, y of second point = 420
decreasing
y of first point = 420, y of second point = 510
increasing
y of first point = 510, y of second point = 360
decreasing
y of first point = 360, y of second point = 330
decreasing
- Demo. Demo your solution for a lab instructor
- Continue to Part D.
Part D: Find turning points
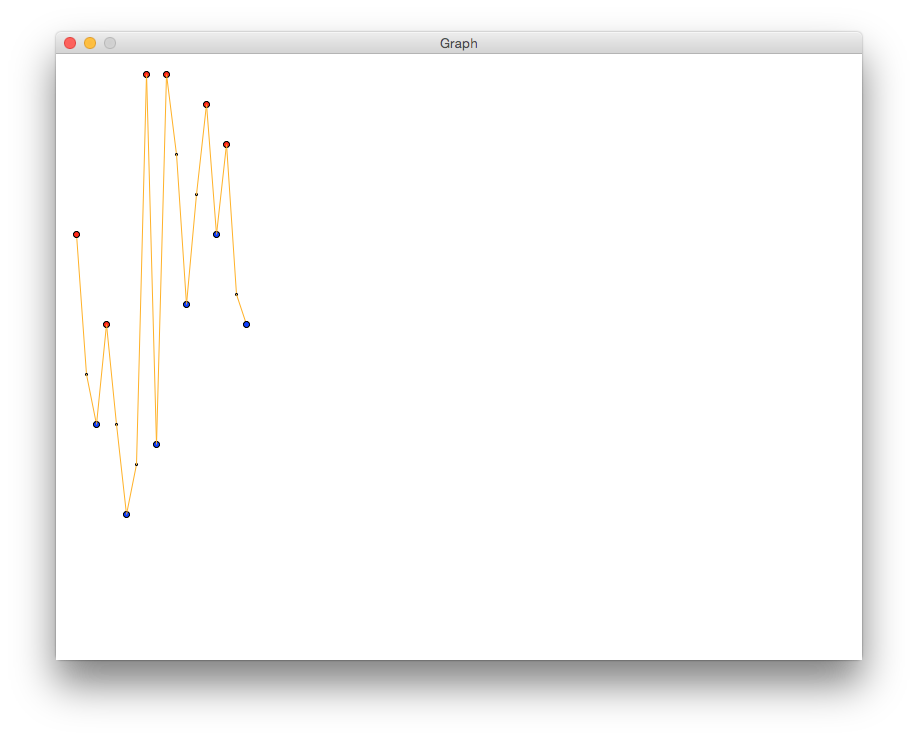
You now have a solution that can detect if the second point of two consecutive points of a sequence is moving downward or upward. In this version, you will detect the turning points. That is, you will determine if we have just seen a peak or a valley. We defined these terms in the section Setup and Practice.
You will color points that are valleys in blue and points that are peaks in red. These points will have radii of 3, instead of a radius of 1 like the other points.
Instructions
- Create a new Python file named lab04d.py:
"""
Program: CS 115 Lab 4d
Author: Your name
Description: This program draws a graph and identifies turning points.
"""
from graphics import *


def main():
    window_height = 600
    window = GraphWin('Graph', 800, window_height)

    # Open the input file and read the number of points
    pointsfile = open("points-test.txt", "r")
    num_points = int(pointsfile.readline())

    x = 20
    first_y = int(pointsfile.readline())   # get the first y-coordinate
    first_point = Point(x, window_height - first_y)

    x += 10
    second_y = int(pointsfile.readline())
    second_point = Point(x, window_height - second_y)

    # TODO: Complete this code
    # draw the line between these 2 points


    # TODO: Fix this if-statement
    if (second_y is greater than first_y):
      increasing = True
    else:
      increasing = False  # in other words, we're decreasing

    # TODO: Complete this code
    # Use the value of "increasing" to determine and print
    #   whether the first point is a peak or a valley.
    # If it's a peak, draw it in red.
    # If it's a valley, draw it in blue.
    # Use a radius of 3 instead of 1.


    # Update first_y and first_point
    first_y = second_y
    first_point = second_point

    for i in range(2, num_points):  # since we already did first 2
       # Read the next point and update x
       x += 10
       second_y = int(pointsfile.readline())
       second_point = Point(x, window_height - second_y)

       # TODO: Complete this code (copy from Part C)
       # draw the line between first_point and second_point
       # draw a circle centered at first_point with radius 1


       # TODO: Complete this code
       # if the sequence has been increasing:
       #     if first_y is larger than second_y:
       #         we must be at a peak and about to go downward, so
       #         draw a red circle centered at first_point with radius 3
       #         and print that this point is a peak
       # if the sequence has been decreasing:
       #     if first_y is smaller than second_y:
       #         we must be at a valley and about to go upward, so
       #         draw a blue circle centered at first_point with radius 3
       #         and print that this point is a valley


       # Determine if its increasing or not
       increasing = second_y > first_y  # Think about why this works!

       # second_point becomes the first point of the next line
       first_y = second_y
       first_point = second_point

    # TODO: Complete this code
    # Decide and print whether first_point is a peak or a valley,
    #   and then draw the appropriate circle

    window.getMouse()
    window.close()


main()
Complete the code where indicated. Your graph should look like the following:
- Add print statements to generate this output:
420 is a peak.
230 is a valley.
330 is a peak.
140 is a valley.
580 is a peak.
210 is a valley.
580 is a peak.
350 is a valley.
550 is a peak.
420 is a valley.
510 is a peak.
330 is a valley.
- In your code, modify the line that opens the input file to:
pointsfile = open("points.txt", "r")Rerun your program. It should identify 6 peaks and 7 valleys. - Demo. When the above seems to be working, call an instructor to demo your code (still using points.txt).
- Make sure that your name is at the top of the file and the docstring has been updated to describe the new functionality you have added. Make sure the program is still modified so it uses points.txt
- Continue to the next part to submit your program.
Assignment Submission
Instructions
- Answer the last question (#8) in your Moodle writeup. Review your answers, and then click the "Next" button at the bottom of the quiz. Once you do that, you should see a "Summary of Attempt" screen.
- Click the "Submit all and finish" button. Warning: You must hit "Submit all and finish" so that your writeup can be graded! It is not submitted until you do this.
Once you have submitted your quiz, you should see something similar to this at the top of your Moodle window. The important part is that the State shows up as Finished.
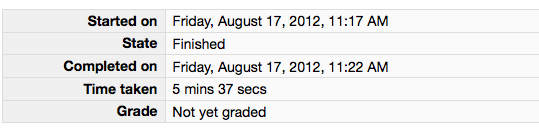
Please leave this tab open in your browser. - Click on the "Lab 4 code" link in Moodle and open in a new tab. Follow the instructions to upload your source code (lab04d.py) for Lab04. You could either browse for your code or, using a finder window, drag and drop your lab04d.py from your cs115/Lab04 folder to Moodle. You should subsequently see a dialog box which indicates 'Submission Status' as 'Submitted for grading'.
- With these confirmation pages open in your browser, you may call an instructor over to verify that you have completed every part of the lab. Otherwise, you are done!