Introduction
The graphics package we are using was written by Zelle for his textbook. Zelle provides online documentation for the graphics package which provides details on the library. Below are examples of how to draw the basic shapes that we use in our labs.
Note: this is more of a reference for the graphics package, and not an introductory text. We learn how to use the package by doing the labs. This tutorial is helpful if you remember we did something in a lab (like draw a circle) and you want to remember how to do that.
The Window
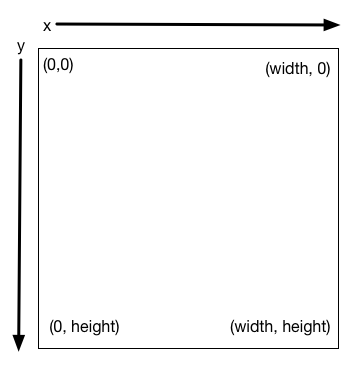
The basic object of the package is the GraphWin object, which creates a window for drawing shapes and doing other things. The coordinate system used within any window starts at (0,0) in the upper-left corner:
The GraphWin object requires 3 parameters:
- name of the window (a string)
- width of the window in pixels (an integer)
- height of the window in pixels (an integer)
The object is created using code like win = GraphWin(name, width, height). By default, the window is opened when it is created, and is closed when the program ends.
Note: For very short-lived programs, it may be hard to even see the window since it closes so fast! Thus, a common pattern we use is shown in the example (below): during execution, the program waits at the getMouse function call until the mouse is clicked somewhere in the window. The effect is that the window stays open until you click it.
Example: GraphWin
from graphics import *
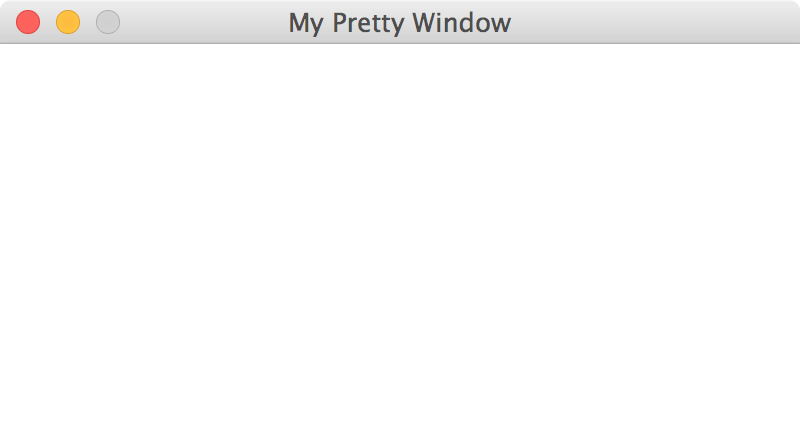
win = GraphWin("My Pretty Window", 400, 200)
win.getMouse()
win.close()
The above code opens the 400x200 window, below:
Point
The Point object has an x-coordinate and a y-coordinate within the window coordinate system.
Points are a basic building block in this library:
- When we build complex shapes, we need one or more
Pointobjects to do that. - When we click on a window, the click gets represented by a
Pointobject.
Example: Point
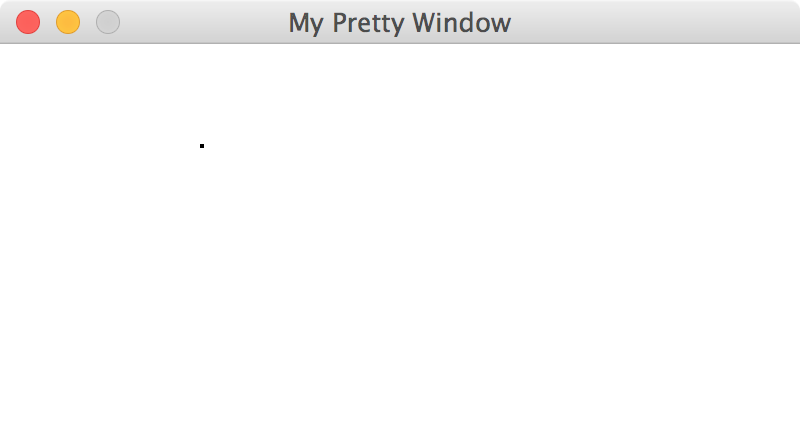
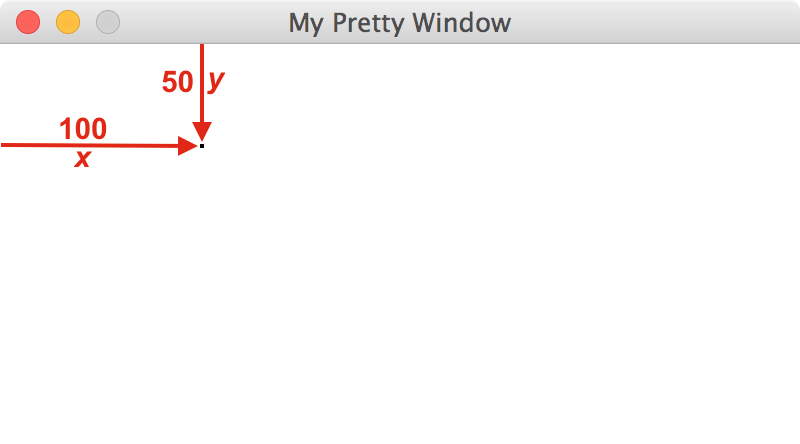
# Ex 1: using (x,y) coordinates to create a Point object
pt = Point(x, y)

# Ex 2: getting coordinates out of a Point object
x_coord = pt.getX()  # x_coord == x
y_coord = pt.getY()  # y_coord == y

# Ex 3: a specific point, shown below
pt3 = Point(100,50)
If we drew the point pt3 (see Ex 3 above) in the window from our GraphWin example, it would appear like below (left) and annotated (right).
Circle
The Circle object is built using center (a point) and a radius (an integer).
Example: Circle
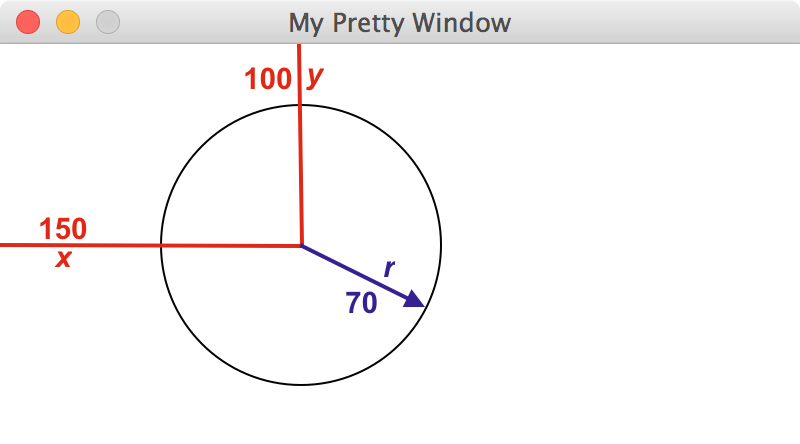
# Ex 1: generic version
center = Point(x, y)
shape = Circle(center, radius)

# Ex 2: written as one line of code, with specific values
circ = Circle(Point(150,100), 70)
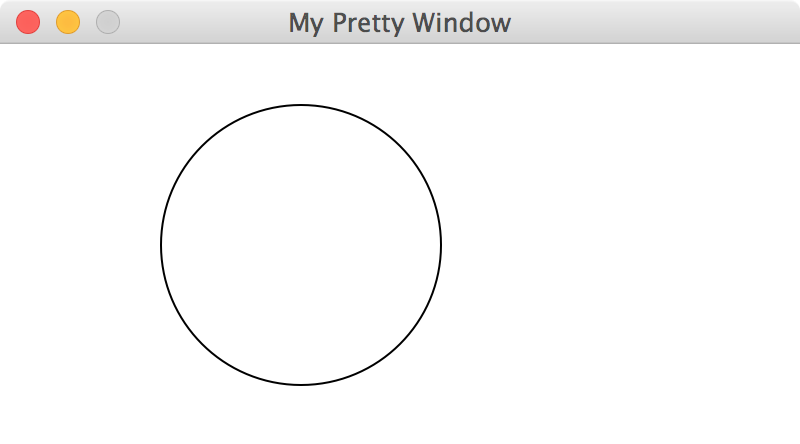
If we drew the circle circ (see Ex 2 above) in the window from our GraphWin example, it would appear like below (left) and annotated (right).
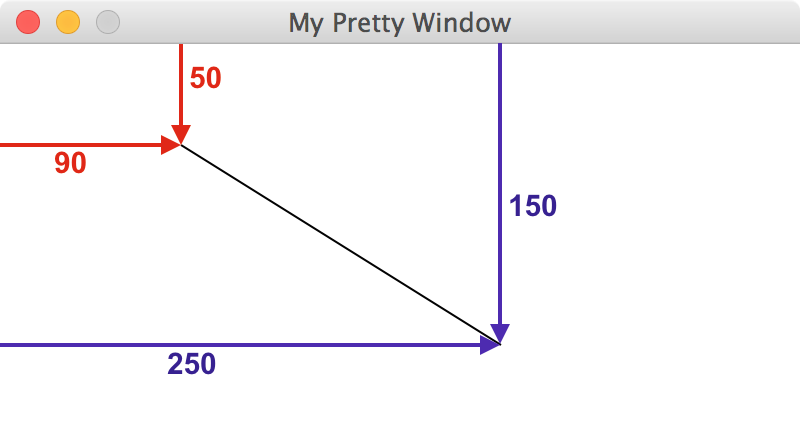
Rectangle
The Rectangle object is built using two vertices: the top-left point, and the bottom-right point.
Example: Rectangle
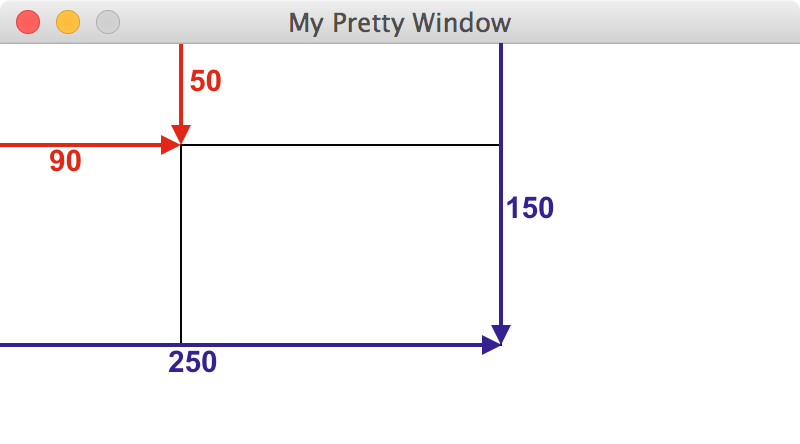
# Ex 1: generic version
top_left_pt = Point(x1, y1)
bottom_right_pt = Point(x2, y2)
shape = Rectangle(top_left_pt, bottom_right_pt)

# Ex 2: written as one line of code, with specific values
rect = Rectangle(Point(90,50), Point(250,150))
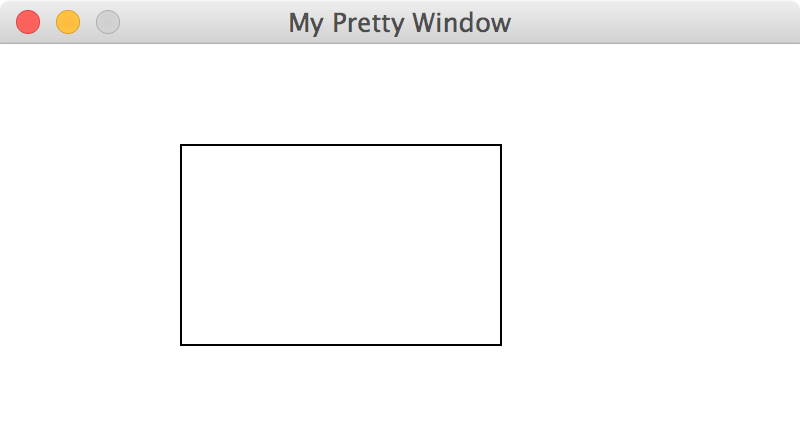
If we drew the rectangle rect (see Ex 2 above) in the window from our GraphWin example, it would appear like below (left) and annotated (right). The width of rect is 160 pixels (= 250-90) and its height is 100 pixels (= 150-50).
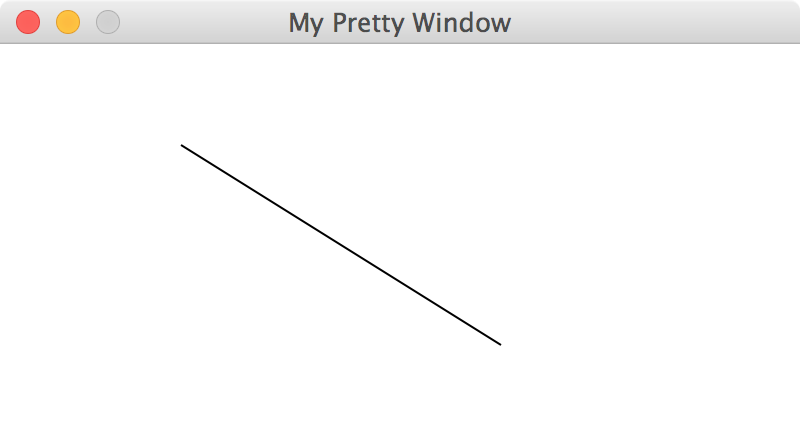
Line
The Line object is built using two endpoints.
Example: Line
# Ex 1: generic version
pt1 = Point(x1, y1)
pt2 = Point(x2, y2)
shape = Line(pt1, pt2)

# Ex 2: written as one line of code, with specific values
seg = Line(Point(90,50), Point(250,150))
If we drew the line segment seg (see Ex 2 above) in the window from our GraphWin example, it would appear like below (left) and annotated (right).
Mouse Behavior
TheGraphWin object provides the getMouse() method function. It returns the Point that the user clicked. You can then make use of that normal Point. For example, using its getX()/getY() methods to learn the x- and y-coordinates of the click.
Example: Click
from graphics import *

win = GraphWin("My Pretty Window", 400, 200)

# 10 times, do the following:
for i in range(10):
    pt = win.getMouse()  # get a click
    c = Circle(pt, 10 + 5*i)  # draw a circle centered there
    c.draw(win)

# wait for an 11th click as signal to close the window
win.getMouse()
win.close()
This short program leads to this interaction:
Caution: if a click occurs when the program is not running the getMouse method, it might get lost or ignored. This leads to the occasional scenario where clicks get missed. You may be able to demonstrate this behavior by clicking in rapid succession in your program. (The graphics library is very simple, and does not expose the logic that more professional libraries use to avoid or solve this problem.)
Shapes: Colors, Width, Outlines, etc.
The shapes you can draw have methods to adjust their appearance. In all cases, you need to adjust the appearance of the shape before you draw it. We summarize these below.
s.setOutline(color)Causes the line describing the exteror of shape
sto have colorcolor.s.setFill(color)Fills in shape
swithcolor, a string representing colors. This link lists many colors that are available to use.Note: for shapes with no interior (like
PointandLine), this method has the same effect assetOutline.s.setWidth(num)Causes the line describing the exteror of shape
sto have the thicknessnumpixels.Note: for shapes with no lines, this does not work (like
Point).s.draw(win)Draws shape
sin the windowwin.s.undraw(win)Removes shape
sfrom the window.
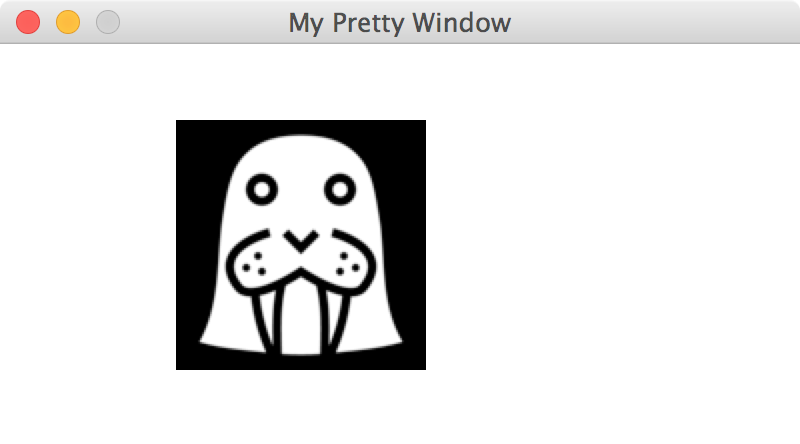
Images
The library can also bring in external images. The first argument is a Point called the image anchor (the image will be centered at this anchor). The second argument is a string that gives the full path to the image file.
Note: only GIF and PGM formats are supported for images, based on the library's use of the Tkinter PhotoImage class.
Example: Image
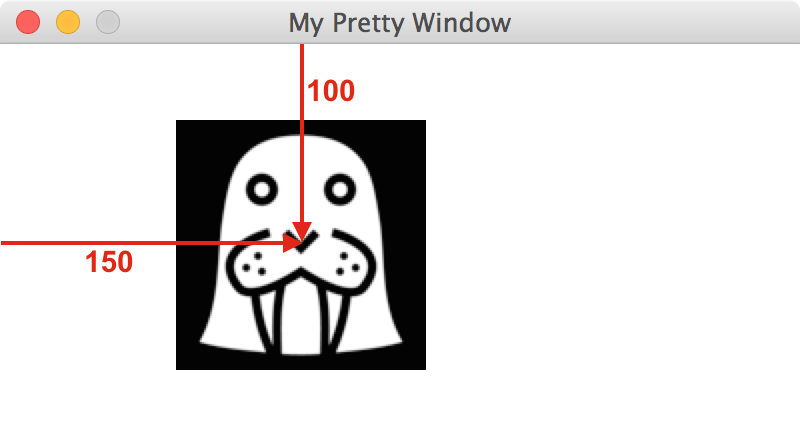
# Ex 1: generic version
anchor = Point(x, y)
Image(anchor, filepath)

# Ex 2: written as one line of code, with specific values
img = Image(Point(150,100), 'walrus-head.gif')
If we drew img (see Ex 2 above) in the window from our GraphWin example, it would appear like below (left) and annotated (right). Also, walrus-head.gif would need to be downloaded to the same directory as the rest of our project, given how the filepath is written.
Source: walrus-head.gif is CC-BY-3.0, various authors (http://game-icons.net/about.html#authors) from http://game-icons.net/.