Second Laboratory Exercise on Text Files
Goals:
The goal of this lab is to cover more complex access to and manipulation of FILEs in C.
Work Started in Class
Part A: Processing Data Files: Median Family Income
File state-income.dat contains information about the median annual income for a 4-person family for the various states for the years 1997 back to 1979. As shown in the file sample that follows, the first five lines contain header information (2 lines of title, a blank line, column headings for various years, and another blank line). Thereafter, the information about each state is on a separate line. Within a line, the state name is left justified in the first 21 characters, and income figures are in 6-character-wide columns (the income appears as 5 characters, and a blank spaces separates one year's income figure from the next).
To illustrate the format, the first part of the file is shown below.
                         Median Income for 4-Person Families, by State, According to the U.S. Census Bureau
                        Reported November 3, 1999 on Web site http://www.census.gov/hhes/income/4person.html

Year                  1997  1996  1995  1994  1993  1992  1991  1990  1989  1988  1987  1986  1985  1984  1983  1982  1981  1980  1979

United States        53350 51518 49687 47012 45161 44615 43056 41451 40763 39051 36812 34716 32777 31097 29184 27619 26274 24332 22395
Alabama              48240 44879 42617 41730 37975 39659 37638 35937 34930 33022 31221 29799 28407 26595 25117 24181 22443 22026 18613
Alaska               57474 62078 56045 53555 51181 49632 49721 51538 48411 47247 47106 41292 42897 44017 38238 31823 35834 32745 31037
Arizona              47133 45032 44526 41599 39679 39900 39364 38799 38347 36892 35711 33477 32129 29431 27551 29835 25163 23832 23000
Arkansas             38646 36828 38520 36510 32594 36682 34566 31913 31853 28665 27415 27157 26255 23075 21524 20710 20583 19448 18493
California           55217 53807 51519 48755 44643 46774 46643 45184 42813 41425 40218 37655 36223 33711 31967 29885 27763 26070 25109
Colorado             58988 53632 50941 48801 47112 45021 43136 41803 40265 39095 37778 36026 35214 34154 32294 30663 28756 25943 25228
Connecticut          72706 67380 62157 62107 59288 55061 54479 53931 53313 50720 47195 44330 40677 39070 37703 35361 31108 28376 24410
Use the information in this file for the following questions.
Do ONE of the following questions (one of step 1, 2, or 3).
Additional problems may be done for further credit.
-
Extract from this file the name of each state and its median income for 1995. Put the results in a new file, called state-income-for-1995
That is, after processing the above file, the new file state-income-for-1995 should begin:
State          1995 Median Income

United States        49687
Alabama              42617
Alaska               56045
Arizona              44526
Arkansas             38520
California           51519
-
From the original state-income file, extract each state's median income for a given year.
That is, the program (or program segment) should ask a user for a year between 1979 and 1997 (inclusive) and print to the screen a listing of state names and their median incomes for that year.
-
From the original state-income file, print to the screen the names of those states for which the median income decreased from some year to the next.
Homework
Do a SECOND of the questions (step 1, 2, or 3).
For those with extra time
Part B: Binary File Input and Output
Previously, you have only worked with writing character data to files in the form of chars and strings. However, complex programs often require you to write large chunks of information to a file. Examples include large databases, a scientific dataset, or even an executable program itself. In C there are two functions that facilitate this this type of reading and writing: fread and fwrite.
-
Review the man pages for fread and fwrite. How are these functions different from fprintf and fgets? How are they similar?
Writing Arbitrary Data
fwrite literally writes bits (the 0s and 1s that represent whatever is pointed to in its first argument) to the file you specify in its last argument. However, to know how many bits to write you have to tell fwrite how big (how many bytes) the data you want to write is and how much data there is. This information corresponds to the second and third arguments respectively.
Suppose you want to write an array of 10 doubles (we'll call it array) to a file. The call to fwrite would look something like this:
fwrite (array, sizeof(double), 10, yourFile);
If you wanted to write just one Pixel structure you had previously declared as pxl, the call would resemble:
fwrite (&pxl, sizeof(Pixel), 1, yourFile);
Do either 5 or 6:
-
Write a program that reads in a series of integers from standard input using any method you prefer. The program should then imediately write these integers to a binary file of your choosing using fwrite.
-
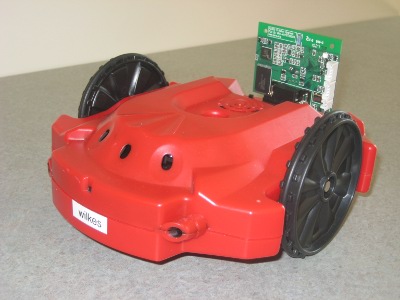
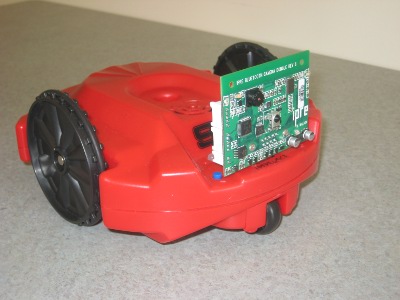
Write a program that instructs the robot to take a picture and then print the struct with the picture data to a file using fwrite.
Reading Bits Back In
Not suprisingly, fread functions exactly like fwrite except in reverse. It reads the data in in the same manner -- where you specify the data to be read, the sizeof the data, and how many 'packets' of data you want.
Complete the question you chose to do earlier:
-
Write a program that reads in integers from the binary file and writes them - each on a new line - to stdout.
-
Write a program that uses fread to read the binary data for a picture struct and the uses rDisplayPicture from the MyroC header to display the picture.
|
Part A: created and revised 27 September 2001 - 2 May 2005 by
Henry M. Walker Part B: created and revised 11 August 2011 by David Cowden and Erik Opavsky edited 12 December 2011 by Henry M. Walker outdated URL reference removed 1 November 2013 by Henry M. Walker reformatted 2-3 February 2014 by Henry M. Walker readings added 19 September 2014 by Henry M. Walker reformatted and edited 26 October 2016 by Henry M. Walker |
|
| For more information, please contact Henry M. Walker at walker@cs.grinnell.edu. |


