Goals
In this project, you will make a calculator that determines the Air Quality Index (AQI) from sensor data, following methods published by the US Environmental Protection Agency (EPA).
You will be practicing the following concepts from prior labs:
for-loops- conditionals
- math calculations
- accumulator pattern
- min/max/avg calculations
- non-trivial
printstatements
Summary
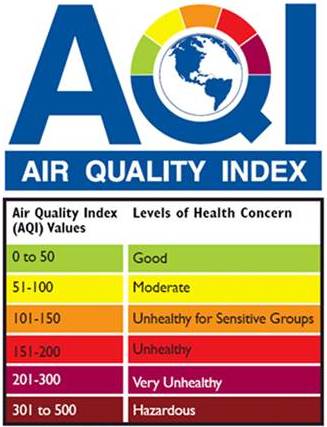
The Air Quality Index (AQI) is a simple, unitless index used to communicate air pollution to the general public. EPA's AirNow website shows interactive maps with the current AQI, as well as AQI forecasts.
To calculate the AQI, the US EPA draws from various environmental monitors that each record a pollutant. Six pollutant types are used to calculate the AQI:
- PM2.5
- Fine particulate matter with 2.5 micrometer diameter or smaller; examples include ash, smoke and smog.
- PM10
- Coarse particulate matter with 10--2.5 micrometer diameter; examples include dust, pollen and mold.
- NO2
- Nitrogen dioxide
- SO2
- Sulphur dioxide
- CO
- Carbon monoxide
- O3
- Ozone
You will write a calculator that prompts the user for sensor data from multiple locations, calculates the AQI for each location, and then reports some summary statistics about these locations. This calculator will be built in stages: Checkpoint A, Checkpoint B, and then Final Code. There is a demo associated with each intermediate stage.
Part of this project is an exercise in having control over functions and patterns to produce target outputs. It is not a creative exercise, but rather the opportunity for you to demonstrate precision, control and being detail-oriented. You are asked to demonstrate the requested behavior and output, matching the sample output exactly. In all samples below, user input is shown in italics and underlined.
Due Dates
- Checkpoint A: Due as a demo in any lab, drop-in tutoring or workshop before Thursday, Sept. 21 at 7 PM.
- Checkpoint B: Due as a demo in any lab, drop-in tutoring or workshop before Thursday, Sept. 28 at 7 PM.
- Final Code: Due via Moodle on Thursday, Oct. 5 at 11:55 PM.
Calculation Details
To write your calculator, you will need to understand the formula and data used by the EPA to calculate AQI. You will need to refer to the below AQI Equation and AQI Breakpoint Table for constants and logic to write your program.
AQI Equation
For each pollutant P, the sensor gives a concentration reading CP. This reading is typicaly an average over some period of time. The index for that pollutant is given by the following equation:
IP = (Ihigh - Ilow) / (Chigh - Clow) * (CP - Clow) + Ilow
These variables are the following:
- CP
- The concentration of pollutant P.
- Clow, Chigh
- The low/high concentration breakpoints that contain CP. These breakpoints are defined by the EPA in the Breakpoint Table (below).
- Ilow, Ihigh
- The low/high index range associated with concentration breakpoints for CP.
- PM2.5: truncate to 1 decimal place (µg/m3)
- PM10: truncate to integer (µg/m3)
- NO2: truncate to integer (ppb)
- SO2: truncate to integer (ppb)
- CO: truncate to 1 decimal place (ppm)
- O3: truncate to integer (ppb)
After we have the index for each pollutant, the AQI is simply the maximum index across all pollutants.
Per EPA guidance, you should truncate all sensor values before calculation in the following way:
AQI Breakpoint Table
Category |
AQI |
PM2.5 (µg/m3) 24hr avg |
PM10 (µg/m3) 24hr avg |
NO2 (ppb) 1hr avg |
SO2 (ppb) 1hr avg |
CO (ppm) 8hr avg |
O3 (ppb) 8hr avg |
O3 (ppb) 1hr avg |
|---|---|---|---|---|---|---|---|---|
| Good | 0--50 | 0--12.0 | 0--54 | 0--53 | 0--35 | 0--4.4 | 0--54 | - |
| Moderate | 51--100 | 12.1--35.4 | 55--154 | 54--100 | 36--75 | 4.5--9.4 | 55--70 | - |
| Unhealthy for Sensitive Groups |
101--150 | 35.5--55.4 | 155--254 | 101--360 | 76--185 | 9.5--12.4 | 71--85 | 125--164 |
| Unhealthy | 151--200 | 55.5--150.4 | 255--354 | 361--649 | 186--304 | 12.5--15.4 | 86--105 | 165--204 |
| Very Unhealthy | 201--300 | 150.5--250.4 | 355--424 | 650--1249 | 305--604 | 15.5--30.4 | 106--200 | 205--404 |
| Hazardous | 301--500 | 250.5--500.4 | 425--604 | 1250--2049 | 605--1004 | 30.5--50.4 | - | 405--604 |
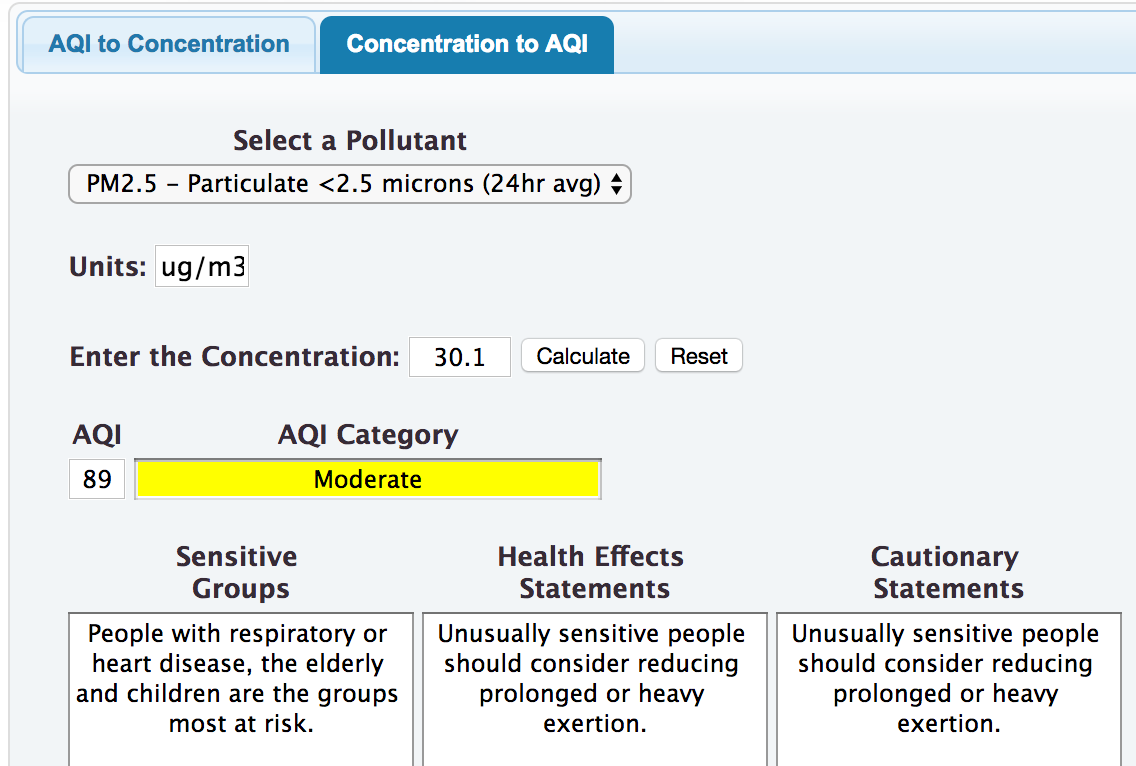
Example: AQI Calculation
IPM-2.5 = (Ihigh - Ilow) / (Chigh - Clow) * (CP - Clow) + Ilow
IPM-2.5 = (100 - 51) / (35.4 - 12.1) * (30.1 - 12.1) + 51 = 88.85 = 89
We can check this calculation using the EPA's AQI calculator:
Checkpoint A
For Checkpoint A, you will need to demonstrate a program that does the following:
- Prompts the user to enter the number of locations for which AQI will be calculated. For Checkpoint A, you can assume that the user always enters a positive integer (greater than zero).
- Prompts the user to enter the name of each location.
- Prompts the user, per location, to enter the pollutant concentrations for PM2.5, PM10 and NO2 monitors. You can assume that the user always enters a valid float value for these.
- Calculates and prints the quality index for each pollutant and, for each location, prints the final AQI and the category label for the AQI.
- Follows the EPA guidance on truncating the sensor readings (see the AQI Equation), and rounds the final calculated AQI to the nearest integer.
Matches the sample input/output below.
The spacing will be checked. You can highlight over the sample to see the spacing. For example, there are four spaces in front of the first
->.We will use additional sample inputs to test your demo and your final program, and so should you. You can test your program using the AQI calculator to check answers; however, there may be discrepancies with out-of-range concentrations.
- Demo. Demo Checkpoint A.
Sample Input/Output
- Sample 1
=== Air Quality Index (AQI) Calculator === Select the number of locations for the report: 1 Enter name of ** Location 1 **: Rohnert Park -> PM-2.5 [ug/m3, 24-hr avg] Monitor: 3.2 PM-2.5 concentration 3.2 yields 13 index -> PM-10 [ug/m3, 24-hr avg] Monitor: 0 PM-10 concentration 0 yields 0 index -> NO2 [ppb, 1-hr avg] Monitor: 2.5 NO2 concentration 2 yields 2 index AQI for Rohnert Park is 13 Condition: Good- Sample 2
=== Air Quality Index (AQI) Calculator ===
Select the number of locations for the report: 2

Enter name of ** Location 1 **: San Bernadino
    -> PM-2.5 [ug/m3, 24-hr avg] Monitor: 35.82
       PM-2.5 concentration 35.8 yields 102 index
    -> PM-10 [ug/m3, 24-hr avg] Monitor: 70.7
       PM-10 concentration 70 yields 58 index
    -> NO2 [ppb, 1-hr avg] Monitor: 205.2
       NO2 concentration 205 yields 121 index
    AQI for San Bernadino is 121
    Condition: Unhealthy for Sensitive Groups

Enter name of ** Location 2 **: Newport Beach
    -> PM-2.5 [ug/m3, 24-hr avg] Monitor: 10.59
       PM-2.5 concentration 10.5 yields 44 index
    -> PM-10 [ug/m3, 24-hr avg] Monitor: 40.1
       PM-10 concentration 40 yields 37 index
    -> NO2 [ppb, 1-hr avg] Monitor: 25
       NO2 concentration 25 yields 24 index
    AQI for Newport Beach is 44
    Condition: Good
Advice and Hints
Hint: There is some syntactic sugar in Python to assign values to multiple variables with a single line of code:
x, y, z = 1, 2, 3 # assigns x the value 1, y the value 2 and z the value 3
Hint: There is some syntactic sugar in Python to chain conditionals:
if (1 <= x <= 10):
    # this is the same as if (1 <= x) and (x <= 10):
    print("Hi!")
Hint: float('inf') is larger than every other float, and float('-inf') is smaller than every other float. You may find these useful as variable initializers, when you are tracking minima and maxima.
Checkpoint B
For Checkpoint B, you will extend your code from Checkpoint A by supporting all pollutants and printing summary statistics:
- Extend your program to support the pollutant concentration from SO2, CO and O3 monitors.
- When calculating the ozone AQI, ignore 1-hr ozone readings less than 125 ppb and 8-hr ozone readings greater than 200 ppb; otherwise, the ozone AQI between 100 and 300 is computed by selecting the larger of the AQI calculated using the 1-hour ozone reading and the AQI calculated using the 8-hour ozone reading.
- After the AQI of each location has been reported, print a summary report that features: the location with the maximum AQI, the location with the minimum AQI, and the average PM2.5 concentration (average of those locations that had monitor readings for that pollutant).
- Demo. Demo Checkpoint B.
Sample Input/Output
- Sample 3
=== Air Quality Index (AQI) Calculator === Select the number of locations for the report: 1 Enter name of ** Location 1 **: Cupertino -> PM-2.5 [ug/m3, 24-hr avg] Monitor: 12.3 PM-2.5 concentration 12.3 yields 51 index -> PM-10 [ug/m3, 24-hr avg] Monitor: 0.1 PM-10 concentration 0 yields 0 index -> NO2 [ppb, 1-hr avg] Monitor: 0.5 NO2 concentration 0 yields 0 index -> SO2 [ppb, 1-hr avg] Monitor: 11 SO2 concentration 11 yields 16 index -> CO [ppm, 8-hr avg] Monitor: 12 CO concentration 12.0 yields 143 index -> O3 [ppb, 8-hr avg] Monitor: 110 -> O3 [ppb, 1-hr avg] Monitor: 170 O3 concentration 110 yields 205 index AQI for Cupertino is 205 Condition: Very Unhealthy Summary Report Location with max AQI is Cupertino (205) Location with min AQI is Cupertino (205) Avg PM-2.5 concentration reading: 12.3- Sample 4
=== Air Quality Index (AQI) Calculator ===
Select the number of locations for the report: 3

Enter name of ** Location 1 **: Davis
    -> PM-2.5 [ug/m3, 24-hr avg] Monitor: 130
       PM-2.5 concentration 130.0 yields 189 index
    -> PM-10 [ug/m3, 24-hr avg] Monitor: 25.33
       PM-10 concentration 25 yields 23 index
    -> NO2 [ppb, 1-hr avg] Monitor: 5.4
       NO2 concentration 5 yields 5 index
    -> SO2 [ppb, 1-hr avg] Monitor: 0
       SO2 concentration 0 yields 0 index
    -> CO [ppm, 8-hr avg] Monitor: 1.4
       CO concentration 1.4 yields 16 index
    -> O3 [ppb, 8-hr avg] Monitor: 69
    -> O3 [ppb, 1-hr avg] Monitor: 100
       O3 concentration 69 yields 97 index
    AQI for Davis is 189
    Condition: Unhealthy

Enter name of ** Location 2 **: Woodland
    -> PM-2.5 [ug/m3, 24-hr avg] Monitor: 20
       PM-2.5 concentration 20.0 yields 68 index
    -> PM-10 [ug/m3, 24-hr avg] Monitor: 10
       PM-10 concentration 10 yields 9 index
    -> NO2 [ppb, 1-hr avg] Monitor: 40
       NO2 concentration 40 yields 38 index
    -> SO2 [ppb, 1-hr avg] Monitor: 15
       SO2 concentration 15 yields 21 index
    -> CO [ppm, 8-hr avg] Monitor: 1.4
       CO concentration 1.4 yields 16 index
    -> O3 [ppb, 8-hr avg] Monitor: 10.5
    -> O3 [ppb, 1-hr avg] Monitor: 123
       O3 concentration 10 yields 9 index
    AQI for Woodland is 68
    Condition: Moderate

Enter name of ** Location 3 **: Vacaville
    -> PM-2.5 [ug/m3, 24-hr avg] Monitor: 10
       PM-2.5 concentration 10.0 yields 42 index
    -> PM-10 [ug/m3, 24-hr avg] Monitor: 2
       PM-10 concentration 2 yields 2 index
    -> NO2 [ppb, 1-hr avg] Monitor: 10
       NO2 concentration 10 yields 9 index
    -> SO2 [ppb, 1-hr avg] Monitor: 5
       SO2 concentration 5 yields 7 index
    -> CO [ppm, 8-hr avg] Monitor: 2.4
       CO concentration 2.4 yields 27 index
    -> O3 [ppb, 8-hr avg] Monitor: 8
    -> O3 [ppb, 1-hr avg] Monitor: 165
       O3 concentration 165.0 yields 151 index
    AQI for Vacaville is 151
    Condition: Unhealthy

Summary Report
    Location with max AQI is Davis (189)
    Location with min AQI is Woodland (68)
    Avg PM-2.5 concentration reading: 53.3
Final Code
In your final code, you will extend the above code to handle two special user-input scenarios:
- If a user inputs a zero or a negative value for 'number of locations' then print an error message and exit (see samples 5 and 6 below).
- If a user inputs a negative pollutant concentration, interpret this as meaning there is no monitor for that pollutant at that location and, subsequently, ignore that pollutant during relevant calculations (see sample 7 below).
There is no demo for your final code.
Advice and Hints
Hint: The exit() function in the sys library can be used to halt the program running and report an exit code back to the operating system. Please use exit(-1), which will report it as an error. Here is a little code demonstrating this, but note that it will not run in PythonTutor (which does not let you use the sys library). You will need to copy-paste the code and run it in a different environment.
Hint: Be careful about computing the average PM-2.5 concentations across locations, in the scenario that the user did not have a PM-2.5 reading at some locations. For example, in Sample 7, the average PM-2.5 value is 8.5 ug/m3, which is just the average of Santa Cruz's and Watsonville's two readings.
Sample Input/Output
- Sample 5
=== Air Quality Index (AQI) Calculator ===
Select the number of locations for the report: 0
Error: 0 is not a valid input.
- Sample 6
=== Air Quality Index (AQI) Calculator ===
Select the number of locations for the report: -20
Error: -20 is not a valid input.
- Sample 7
=== Air Quality Index (AQI) Calculator ===
Select the number of locations for the report: 3

Enter name of ** Location 1 **: Santa Cruz
    -> PM-2.5 [ug/m3, 24-hr avg] Monitor: 5
       PM-2.5 concentration 5.0 yields 21 index
    -> PM-10 [ug/m3, 24-hr avg] Monitor: 12.5
       PM-10 concentration 12 yields 11 index
    -> NO2 [ppb, 1-hr avg] Monitor: 20.8
       NO2 concentration 20 yields 19 index
    -> SO2 [ppb, 1-hr avg] Monitor: 4
       SO2 concentration 4 yields 6 index
    -> CO [ppm, 8-hr avg] Monitor: 1.1
       CO concentration 1.1 yields 12 index
    -> O3 [ppb, 8-hr avg] Monitor: -1
    -> O3 [ppb, 1-hr avg] Monitor: -1
    AQI for Santa Cruz is 21
    Condition: Good

Enter name of ** Location 2 **: Watsonville
    -> PM-2.5 [ug/m3, 24-hr avg] Monitor: 12
       PM-2.5 concentration 12.0 yields 50 index
    -> PM-10 [ug/m3, 24-hr avg] Monitor: -1
    -> NO2 [ppb, 1-hr avg] Monitor: -1
    -> SO2 [ppb, 1-hr avg] Monitor: -1
    -> CO [ppm, 8-hr avg] Monitor: -1
    -> O3 [ppb, 8-hr avg] Monitor: -1
    -> O3 [ppb, 1-hr avg] Monitor: -1
    AQI for Watsonville is 50
    Condition: Good

Enter name of ** Location 3 **: Salinas
    -> PM-2.5 [ug/m3, 24-hr avg] Monitor: -1
    -> PM-10 [ug/m3, 24-hr avg] Monitor: -1
    -> NO2 [ppb, 1-hr avg] Monitor: 55
       NO2 concentration 55 yields 52 index
    -> SO2 [ppb, 1-hr avg] Monitor: -1
    -> CO [ppm, 8-hr avg] Monitor: 3.0
       CO concentration 3.0 yields 34 index
    -> O3 [ppb, 8-hr avg] Monitor: 56
    -> O3 [ppb, 1-hr avg] Monitor: -1
       O3 concentration 56 yields 54 index
    AQI for Salinas is 54
    Condition: Moderate

Summary Report
    Location with max AQI is Salinas (54)
    Location with min AQI is Santa Cruz (21)
    Avg PM-2.5 concentration reading: 8.5
Extra Credit
You can get extra credit by checking for more error conditions. For example, you could reject NO2 concentrations that fall outside the range from the AQI Breakpoint Table. In each case, the program should display a user-friendly message before exiting. You will get max +1 points for each boundary condition you check.
You can get extra credit by checking that, when no sensor data is input to the program for a location, it should not print the AQI for that location (+3), since none can be calculated.
You will get no more than 10 points total for extra credit. Be sure you describe any extra-credit work in your docstring, explaining the judgements you made and you must include references justifying these judgements. If you do not describe your extra credit work, it will get ignored.
Grading Rubric
- Checkpoints [20%]
-
Checkpoint demos are each worth 10 points; each is all or nothing.
- Programming Design and Style [25%]
-
In addition to being correct, your program should be easy to understand and well documented. For details, see the rubric below.
- Correctness [55%]
-
The most important part of your grade is the correctness of your final program. Your program will be tested numerous times, using different inputs, to be sure that it meets the specification. You will not get full credit for this unless your output matches the sample output exactly for every case, including capitalization and spacing. Attention to detail will pay off on this assignment. For details, see the rubric below.
Detailed Rubric
Correctness: functional features (50 points -- 5 points each)
| Feature 1: | For each AQI, a correct and matching "Condition:" message is reported (Ex: Samples 1, 2, 3, 4 and 7). There are six possible condition messages (see the AQI Breakpoint Table for the Category labels). |
| Feature 2: | When the user inputs an invalid number for the number of locations, the program produces an appropriate error message and exit code (Ex: Samples 5 and 6). |
| Feature 3: | The locations with the max and min AQI are correctly reported in the Summary Report (Ex: Samples 3, 4 and 7). |
| Feature 4: | The average PM-2.5 concentration is correctly reported in the Summary Report. This should work for these scenarios: for 1 location (Ex: Sample 3); for multiple locations (Ex: Sample 4); when some locations are missing PM-2.5 measurements (Ex: Sample 7). User input handling should reflect the standard guidance on how to truncate PM-2.5 concentration readings. |
| Feature 5: | Given a concentration for PM-2.5, the per-pollutant (IPM-2.5) index is correctly computed, including: the truncation of the concentration data is performed correctly, all boundary break-points are correctly reasoned, and the index formula is correctly computed. |
| Feature 6: | Given a concentration for PM-10, the per-pollutant (IPM-10) index is correctly computed, including: the truncation of the concentration data is performed correctly, all boundary break-points are correctly reasoned, and the index formula is correctly computed. |
| Feature 7: | Given concentrations for NO2, SO2 and CO, their per-pollutant indices are correctly computed, including: the truncation of the concentration data is performed correctly, all boundary break-points are correctly reasoned, and the index formula is correctly computed. |
| Feature 8: | Given a concentration for O3, the per-pollutant (IO3) index is correctly computed, including: the truncation of the concentration data is performed correctly, all boundary break-points are correctly reasoned, and the index formula is correctly computed. |
| Feature 9: | Given all per-pollutant indices (PM-2.5, PM-10, NO2, SO2, CO, and O3), the location's AQI is correctly computed (Ex: Samples 3 and 4). |
| Feature 10: | Given some per-pollutant indices (PM-2.5, PM-10, NO2, SO2, CO, and O3, where one or more readings are missing from the user's input), the location's AQI is correctly computed (Ex: Sample 7). |
Correctness: spacing, spelling, grammar, punctuation (5 points)
Your spelling, punctuation, etc. get a separate score: each minor error in spacing, punctuation, or spelling gets a score of 2.5, and each major error gets a score of 5. Here is how the score translates to points on the assignment:
| [5] | Score = 0 |
| -1 | 0 < Score <= 2.5 |
| -2 | 2.5 < Score <= 5 |
| -3 | 5 < Score <= 7.5 |
| -4 | 7.5 < Score <= 10 |
| -5 | Score > 10 |
Programming Design and Style (25 points)
- Docstring (5 points)
- There should be a docstring at the top of your submitted file with the following information:
1 pt. Your name (first and last) 1 pt. The course (CS 115) 1 pt. The assignment (e.g., Project 1) 2 pts. A brief description of what the program does - Documentation (6 points)
- Not counting the docstring, your program should contain at least three comments explaining aspects of your code that are potentially tricky for a person reading it to understand. You should assume that the person understands what Python syntax means but may not understand why you are doing what you are doing.
6 pts. You have at least 3 useful comments (2 points each) - Variables (5 points)
-
5 pts. Variables have helpful names that indicate what kind of information they contain. - Algorithm (4 points)
-
2 pts. Your algorithm is straightforward and easy to follow. 2 pts. Your algorithm is reasonably efficient, with no wasted computation or unused variables. - Program structure (5 points)
- All or nothing: your code should define a main function and then call that function, just like our programs do in the lab. Other than library imports, the docstring, and the final call to
main(), you should not have any stray code outside a function definition. - Catchall
- For students using language features that were not covered in class, up to 5 points may be taken off if the principles of programming style are not adhered to when using these features. If you have any questions about what this means, then ask.
Submission
You should submit your final code on Moodle by the deadline. I strongly encourage you to take precautions to make and manage backups while you work on your project, in case something goes wrong either while working or with your submission to Moodle.
Name the file you submit to Moodle yourlastnameP1.py, substituting your actual last name (in lowercase) for yourlastname.
Late Policies
Project late policies are outlined in the course policies page.
Collaboration Policy
Programming projects must be your own work, and academic misconduct is taken very seriously. You may discuss ideas and approaches with other students and the course staff, but you should work out all details and write up all solutions on your own. The following actions will be penalized as academic dishonesty:
- Copying part or all of another student's assignment
- Copying old or published solutions
- Looking at another student's code or discussing it in great detail. You will be penalized if your program matches another student's program too closely.
- Showing your code or describing your code in great detail to anyone other than the course staff or tutor.