CS 115 Lab 5, Part D: Find turning points
[Back to lab instructions]
Introduction
You now have a solution that can detect if the second point of two consecutive points of a
sequence is moving downward or upward. In this version, you will detect the turning
points. That is, you will determine if we have just seen a peak or a valley.
We defined these terms in the section Setup and Practice.
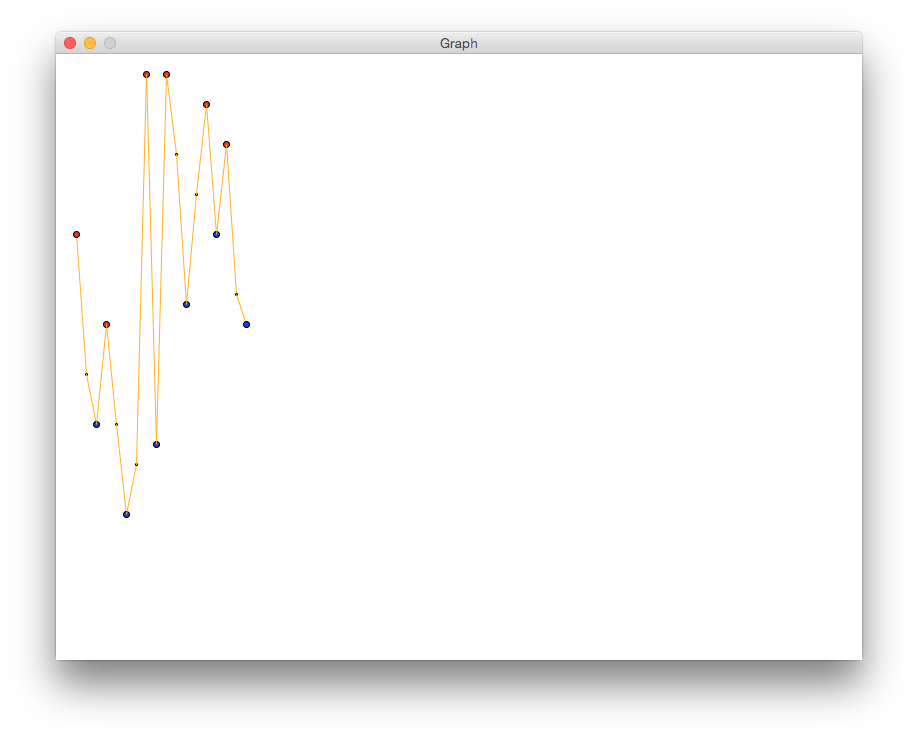
You will color points that are valleys in blue and points that are peaks in red.
These points will have radii of 3, instead of a radius of 1 like the other points.
Instructions
- Create a new Python file named lab05d.py:
"""
Program: CS 115 Lab 5d
Author: Your name
Description: This program draws a graph and identifies turning points.
"""
from graphics import *


def main():
    window_height = 600
    window = GraphWin('Graph', 800, window_height)

    # Open the input file and read the number of points
    pointsfile = open("points-test.txt", "r")
    num_points = int(pointsfile.readline())

    x = 20
    first_y = int(pointsfile.readline())   # get the first y-coordinate
    first_point = Point(x, window_height - first_y)

    x += 10
    second_y = int(pointsfile.readline())
    second_point = Point(x, window_height - second_y)

    ########## Complete this code: draw the line between these 2 points

    ########## Fix this if-statement
    if second_y is greater than first_y
      increasing = True
    else:
      increasing = False  # in other words, we're decreasing

    ############
    # Complete this code:
    # Use the value of "increasing" to determine and print whether the first
    # point is a peak or a valley.

    # If it's a peak, draw it in red. If it's a valley, draw it in blue.
    # Use a radius of 3 instead of 1.
    ############

    # Update first_y and first_point
    first_y = second_y
    first_point = second_point

    for i in range(2, num_points):  # already did first 2
       # Read the next point and update x
       x += 10
       second_y = int(pointsfile.readline())
       second_point = Point(x, window_height - second_y)

       ############
       # Copy this code from Part C
       # draw the line between first_point and second_point
       # draw a circle centered at first_point with radius 1
       ############

       ############
       # Complete this code:
       # if the sequence has been increasing:
       #     if first_y is larger than second_y:
       #         we must be at a peak and about to go downward
       #         draw a red circle centered at first_point with radius 3
       #         print that this point is a peak
       # if the sequence has been decreasing:
       #     if first_y is smaller than second_y:
       #         we must be at a valley and about to go upward
       #         draw a blue circle centered at first_point with radius 3
       #         print that this point is a valley
       ############

       ############
       # Think about why this works!
       increasing = second_y > first_y
       ############

       # second_point becomes the first point of the next line
       first_y = second_y
       first_point = second_point

    ###### Complete this code
    # Decide and print whether first_point is a peak or a valley
    # Draw the appropriate circle

    window.getMouse()
    window.close()


main()
- Complete the code where indicated. Your graph should look like the following:

- Add print statements to generate this output:
420 is a peak.
230 is a valley.
330 is a peak.
140 is a valley.
580 is a peak.
210 is a valley.
580 is a peak.
350 is a valley.
550 is a peak.
420 is a valley.
510 is a peak.
330 is a valley.
- In your code, modify the line that opens the input file to:
pointsfile = open("points.txt", "r")
Rerun your program. It should identify 6 peaks and 7 valleys. When that is working, call an instructor to demo your code.
- Make sure that your name is at the top of the file and the docstring has been updated.
- Continue to Part E.
