CS 115 Lab 5, Part B: Draw a graph
[Back to lab instructions]
Introduction
In this part of the lab, you'll draw a line graph connecting the points that you read in. To draw the graph, you will first draw a line segment between the first
two points. Then, you'll draw a line between the second and third, the third and fourth, etc.
To draw a line segment using the graphics library, you need to provide its two endpoints. Then,
you can color and draw the line just like you did with rectangles and circles. For example:
line = Line(Point(0, 0), Point(50, 50))  # Line from (0, 0) to (50, 50)
line.setOutline('orange')  # Color the line orange
line.draw(window)  # Draw it in the window
There are two issues to be aware of:
- The file contains a list of y-coordinates only. For the x-coordinates, you will put the first point at x=20, the second at x=30, the third at x=40, etc.
We have to be careful when plotting the y-coordinates. The points in the input file are based on the Cartesian coordinate system that you're used to. In this system, the origin is at the lower left, and
points with larger y-values appear toward the top of the graph. In the graphics coordinate system, the origin is at the upper left, and points with larger
y-values appear lower on the graph.
In order to make our graph look like a normal Cartesian graph, you will use window_height - y as the y-coordinate of each point when we draw it.
Answer Question 6 in your writeup. You will need to look back at your output from Part A or look at points-test.txt to to answer this
question.
Instructions
- Create a new Python source code file named lab05b.py:
"""
Program: CS 115 Lab 5b
Author: Your name
Description: This program draws a line graph.
"""
from graphics import *


def main():
    window_height = 600
    window = GraphWin('Graph', 800, window_height)

    # Open the input file and read the number of points
    pointsfile = open("points-test.txt", "r")
    num_points = int(pointsfile.readline())

    # ---- Draw a line between the first and second points
    x = 20  # see note above
    first_y = int(pointsfile.readline())   # get the first y-coordinate
    first_point = Point(x, window_height - first_y)  # see note above

    second_y = int(pointsfile.readline())  # get the second y-coordinate
    x = x + 10
    second_point = Point(x, window_height - second_y)

    # Draw a line between the first two points
    line = Line(first_point, second_point)
    line.setOutline('orange')
    line.draw(window)

    # Draw a circle centered at the first point
    circle = Circle(first_point, 1)
    circle.draw(window)

    #### Line A (for writeup)

    # ---- Draw a line between the second and third points
    first_point = second_point    # the first point of the second line
    second_y = int(pointsfile.readline())  # read the third point
    x = x + 10
    second_point = Point(x, window_height - second_y)

    # Draw the next line
    line = Line(first_point, second_point)
    line.setOutline('orange')
    line.draw(window)

    # Draw the second point
    circle = Circle(first_point, 1)
    circle.draw(window)

    #### Line B (for writeup)

    # ---- Draw a line between the third and fourth points
    first_point = second_point
    second_y = int(pointsfile.readline())  # read the third point
    x = x + 10
    second_point = Point(x, window_height - second_y)

    line = Line(first_point, second_point)
    line.setOutline('orange')
    line.draw(window)

    # Draw the third point
    circle = Circle(first_point, 1)
    circle.draw(window)

    # Draw the fourth point
    circle = Circle(second_point, 1)
    circle.draw(window)

    #### Line C (for writeup)

    window.getMouse()
    window.close()

main()
- Read through the code very carefully. Notice that the endpoints of each of the lines that we have drawn are called first_point
and second_point. In addition, the second point of the first line becomes the first point of the second line. The second point of the second line becomes the first point of the third line. That is why after having drawn the first line, we do the following in preparation for
drawing the second line:
first_point = second_point
We do the same after having drawn the second line in preparation for drawing the third line.
- Answer Question 7 in your writeup. You will need to look back at your output from Part A or look at points-test.txt to to answer this
question.
- We know that we have many lines of this type to draw. Therefore, we will use a loop for this
purpose. The question is how do we set up this loop? Here is an incomplete main function for it:
def main():
    window_height = 600
    window = GraphWin('Graph', 800, window_height)

    # Open the input file and read the number of points
    pointsfile = open("points-test.txt", "r")
    num_points = int(pointsfile.readline())

    x = 20
    first_y = int(pointsfile.readline())   # get the first y-coordinate
    first_point = Point(x, window_height - first_y)

    # We already have the first point, so start with 1.
    for i in range(1, num_points):
        # Read the next point and update x
        second_y = int(pointsfile.readline())
        x += 10
        second_point = Point(x, window_height - second_y)

        ######## COMPLETE THE CODE
        # draw the line between first_point and second_point.
        # draw a circle centered at first_point

        # use the second point of this line for the first point of the next line
        first_point = second_point

    ######## COMPLETE THE CODE
    # again, draw a circle centered at first_point  # Why? for the last point.

    window.getMouse()
    window.close()
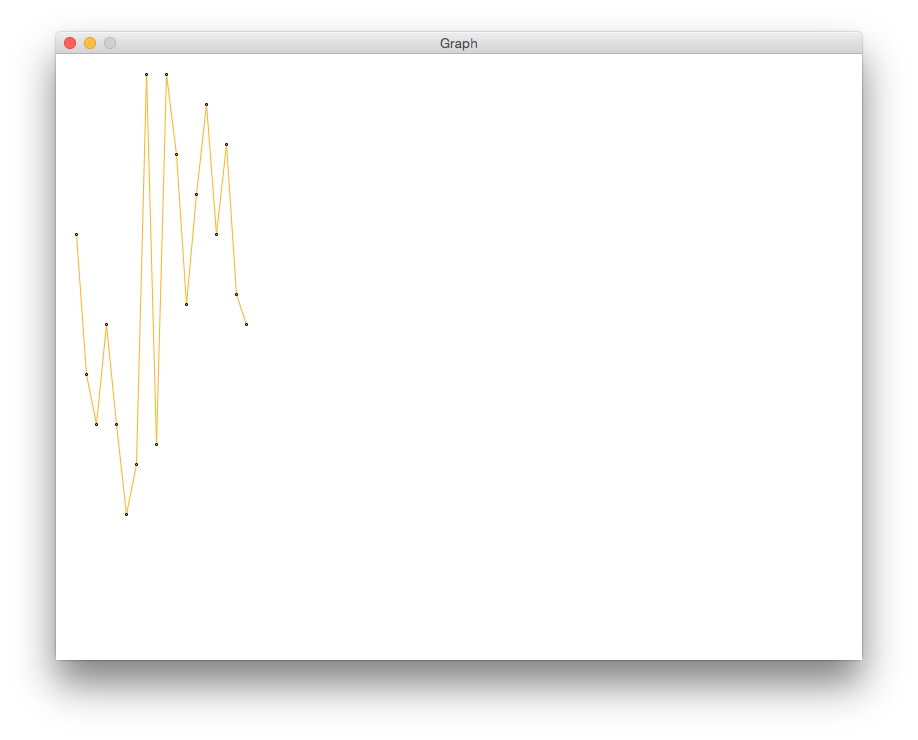
- Complete the code to draw the graph that is represented by all the points. The graph should be
similar to the following image:
- Demo your code for a lab instructor, and then continue to Part C.