Goals
In this project, you will design a graphical program to model genetic drift in Russian River salmon. You will first write a simple graphical interface to provide simulation parameters and then build the core logic for simulating the genetic drift.
You will be practicing the following concepts from prior labs:
while-loops- conditionals
- writing and documenting functions
- lists
- drawing shapes with the graphics package
Summary
You will write a simulator to see how the genetic diversity of a salmon population changes over time.
For our purposes, a gene is a unit of DNA that encodes something specific. An allele is a specific form of that gene. You can think of a gene as being like a variable in programming and an allele as being like the specific value of that variable.
In organisms that reproduce sexually, like our salmon (and humans), individuals will have two copies of each gene: one from the mother, and one from the father. The two alleles (values) of these genes (variables) can be identical or different. If they are identical, the individual is homozygous for that gene. If they are different, the individual is heterozygous.
The genetic diversity of a population refers to the number of unique alleles (values) found in that population. A finite population reproducing among itself will tend to lose genetic diversity over time, which is called genetic drift.
In this project, you will design a graphical program that simulates genetic drift in a population of Russian River salmon.
Part of this project is an exercise in implementing functions to their specification, and matching target outputs. It is not a creative exercise, but rather the opportunity for you to demonstrate understanding of specifications, control over the tools we've learned in the class, and being detail-oriented. You are asked to demonstrate the requested behavior and output, matching both the functions' docstrings and the sample output. In all samples, user input is shown in italics and underlined.
In contrast, the extra credit is a creative exercise, in which you can enhance your user interface in fanciful ways.
Due Dates
- Checkpoint A: Due as a demo in any lab, drop-in tutoring or workshop before Sunday, Oct. 14 at 8 PM.
- Checkpoint B: Due as a demo in any lab, drop-in tutoring or workshop before Thu., Nov. 01 at 8 PM.
- Final Code: Due via Moodle on Fri., Nov. 02 at 11:55 PM.
Template
You will need the graphics package, a helper library and a template for each part of the project:
- Part A: Download the template, template_P2A.py
- Part A: Download the helper package, drift_graphics.py
- Part A: Download the graphics package, graphics.py
- Part A: Download image of a Russian River salmon, salmon.gif
- Part B: Download the template, template_P2.py
Checkpoint A
Template provided for checkpoint A calls the function draw_main_window in drift_graphics.py, which draws the graphical window itself and the salmon pictures. In addition, it uses try-except utility (not covered in class yet) to ensure that the program does not crash if the user closes the graphics window.
For Checkpoint A, you will need to demonstrate a program that does the following:
- Draws three entry boxes on Graphical window (see figure below) where user will specify the number of salmon in the population, the number of unique alleles found in the initial population, and the number of generations to simulate.
- Draws a "Simulate!" button on Graphical window (see figure below).
- When the user clicks "Simulate!", but not when the user clicks in other parts of the window, the user's three text inputs are checked for errors.
- If there are no errors, it prints their values. Otherwise, it indicates the error.
- Closes the graphical window upon a single mouse click.
The window to draw is the following:
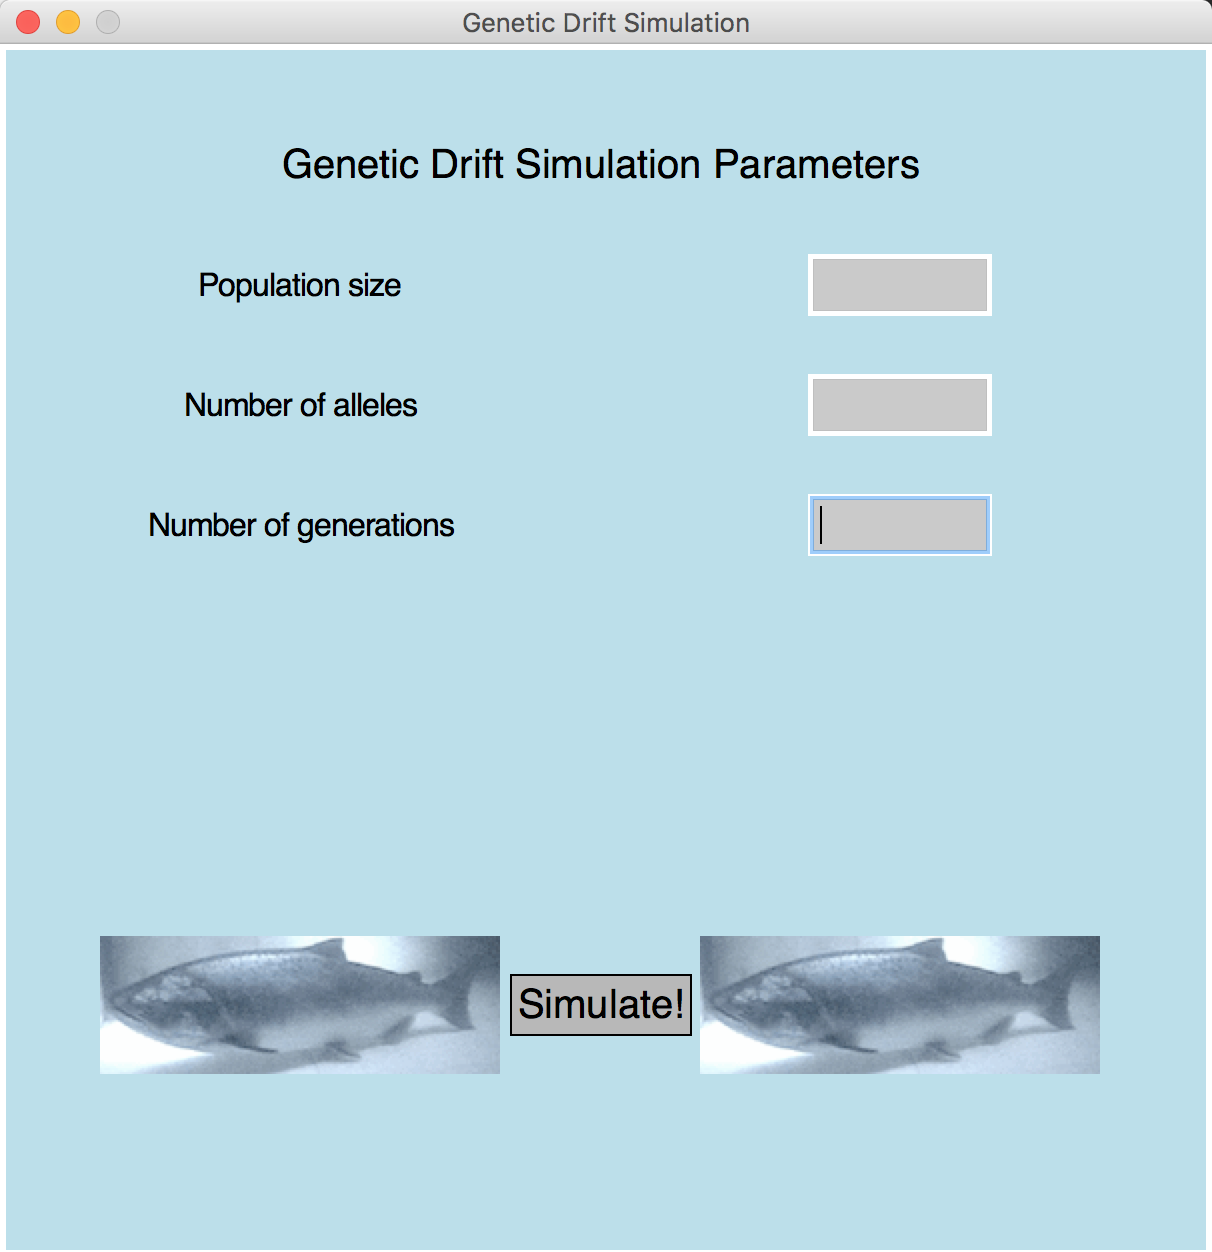
To draw this window successfully and wait for user to click "Simulate!", you will need to call the following functions from drift_graphics.py. You should read the documentation for these functions carefully.
- draw_param_entries (for drawing the text labels and text entry boxes)
- draw_button (for drawing the "Simulate!" button)
- wait_for_button (for waiting until user clicks on the "Simulate!" button,
Once the user has clicked the "Simulate!" button, you should use the getText() method on each element of the entry box list you created. For example:
entryboxes = draw_param_entries(...)
population = entryboxes[0].getText()
You should check the entry boxes for error in the order listed below, and print an error message describing the first error you encounter. The conditions to check for are:
- The population size must be a positive integer (greater than 0).
- The number of distinct alleles must be a positive integer (greater than 0).
- The number of alleles must not be more than 2 * the population size (since each member of the population has 2 copies of the gene.) It's OK if there are fewer -- that just means we have less genetic diversity.
- The number of generations to simulate must be a positive integer (greater than 0).
Sample Input/Output
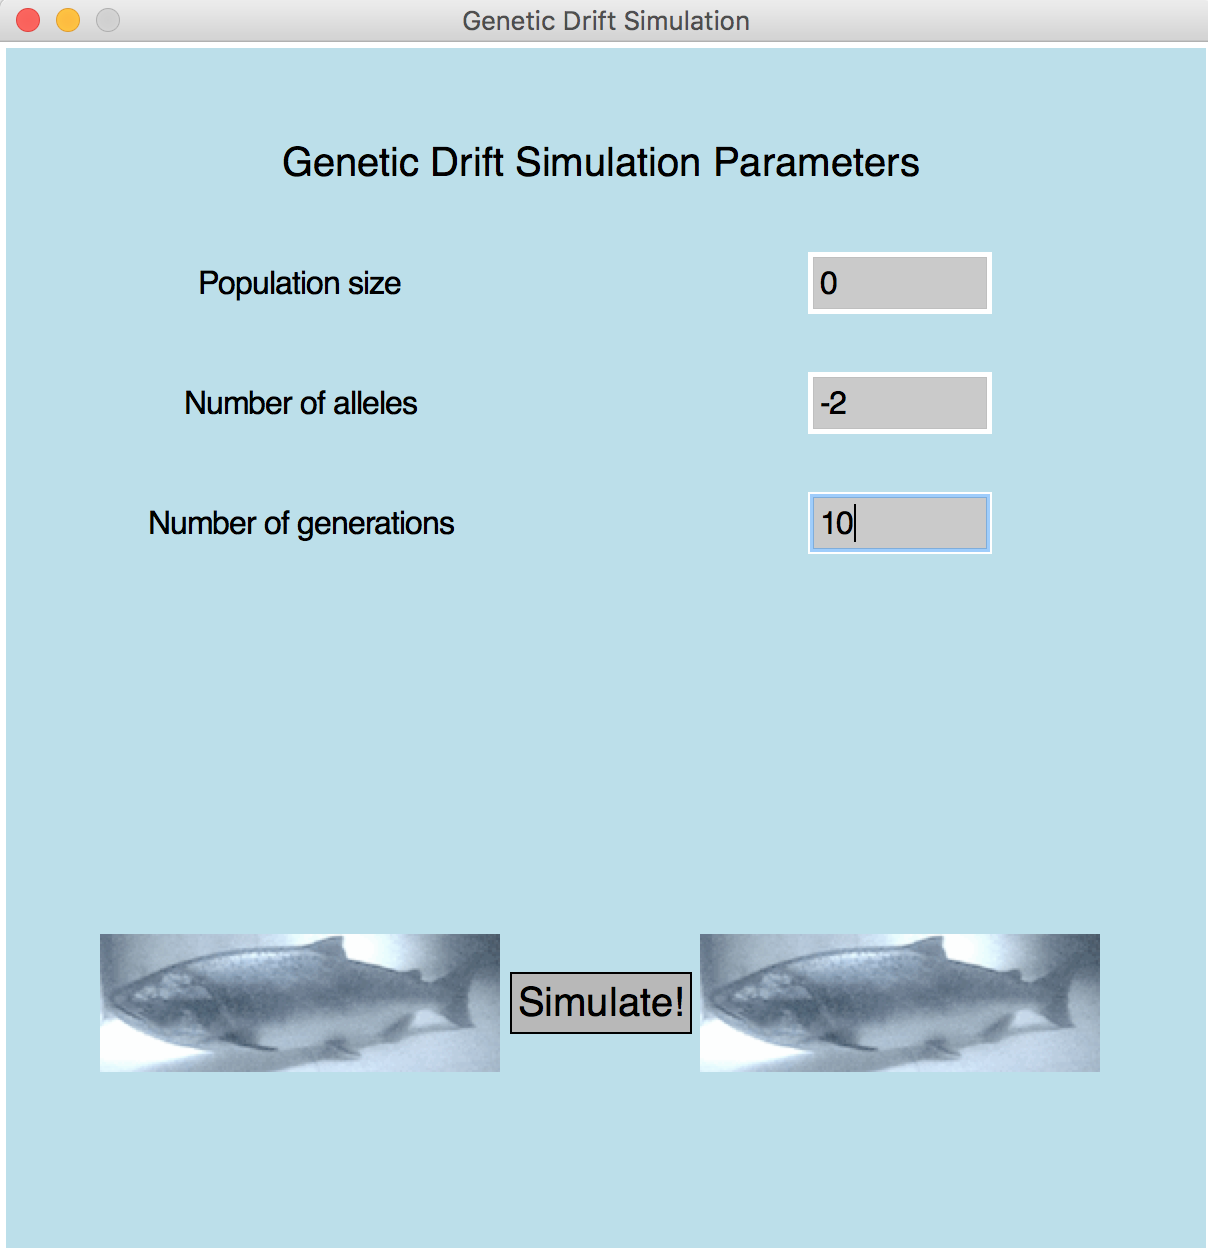
- Sample 1 (window)
The population size must be atleast 1!
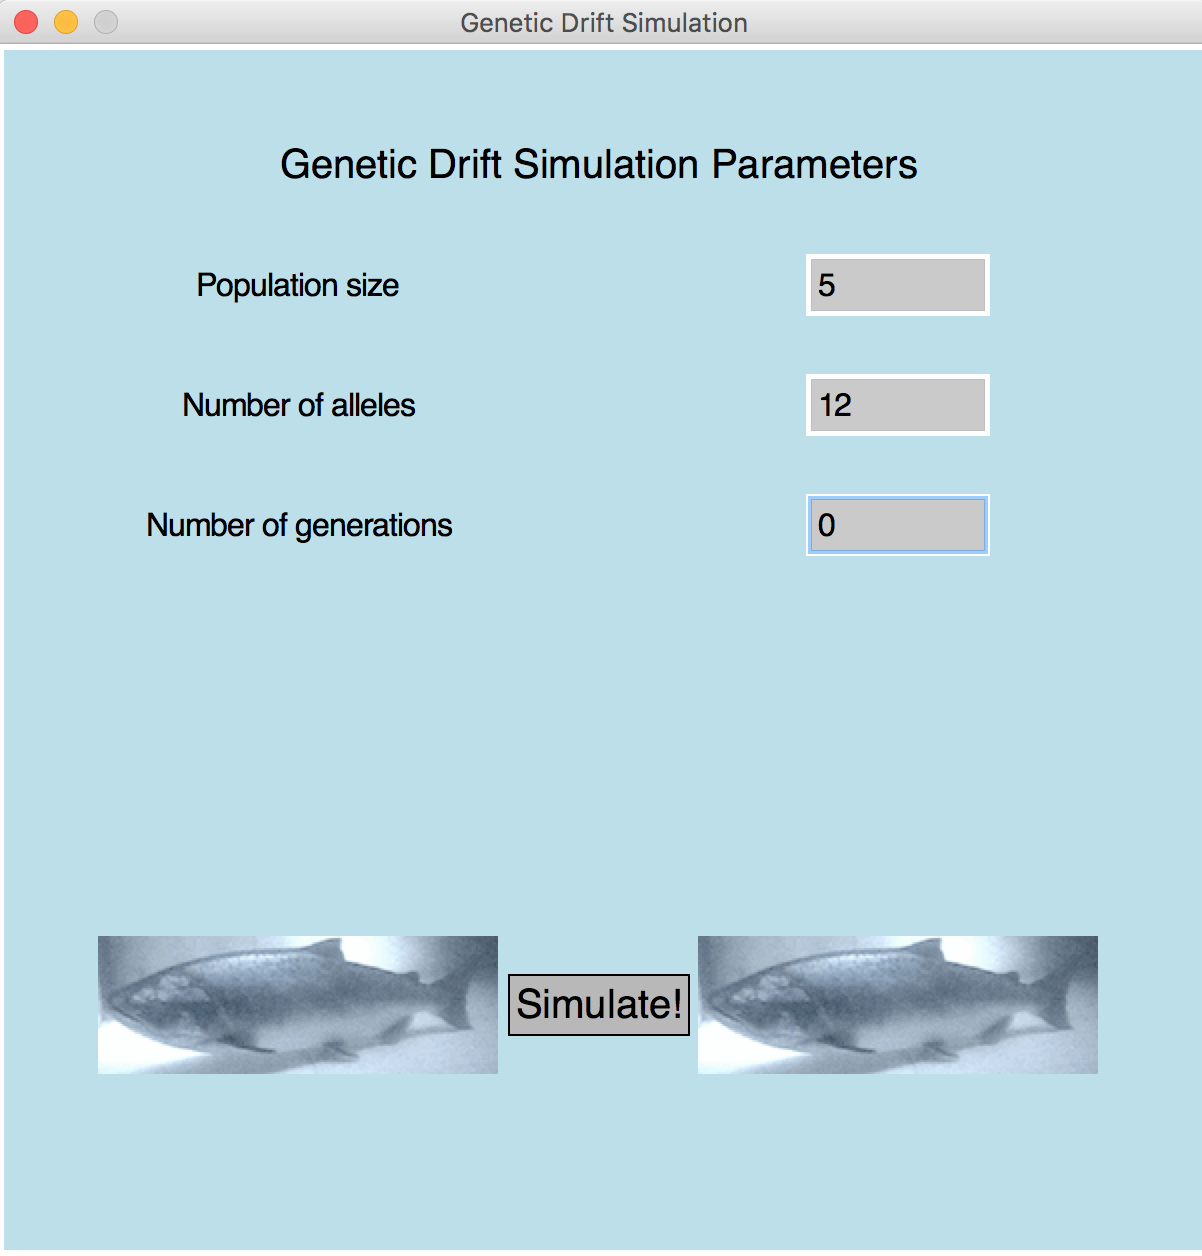
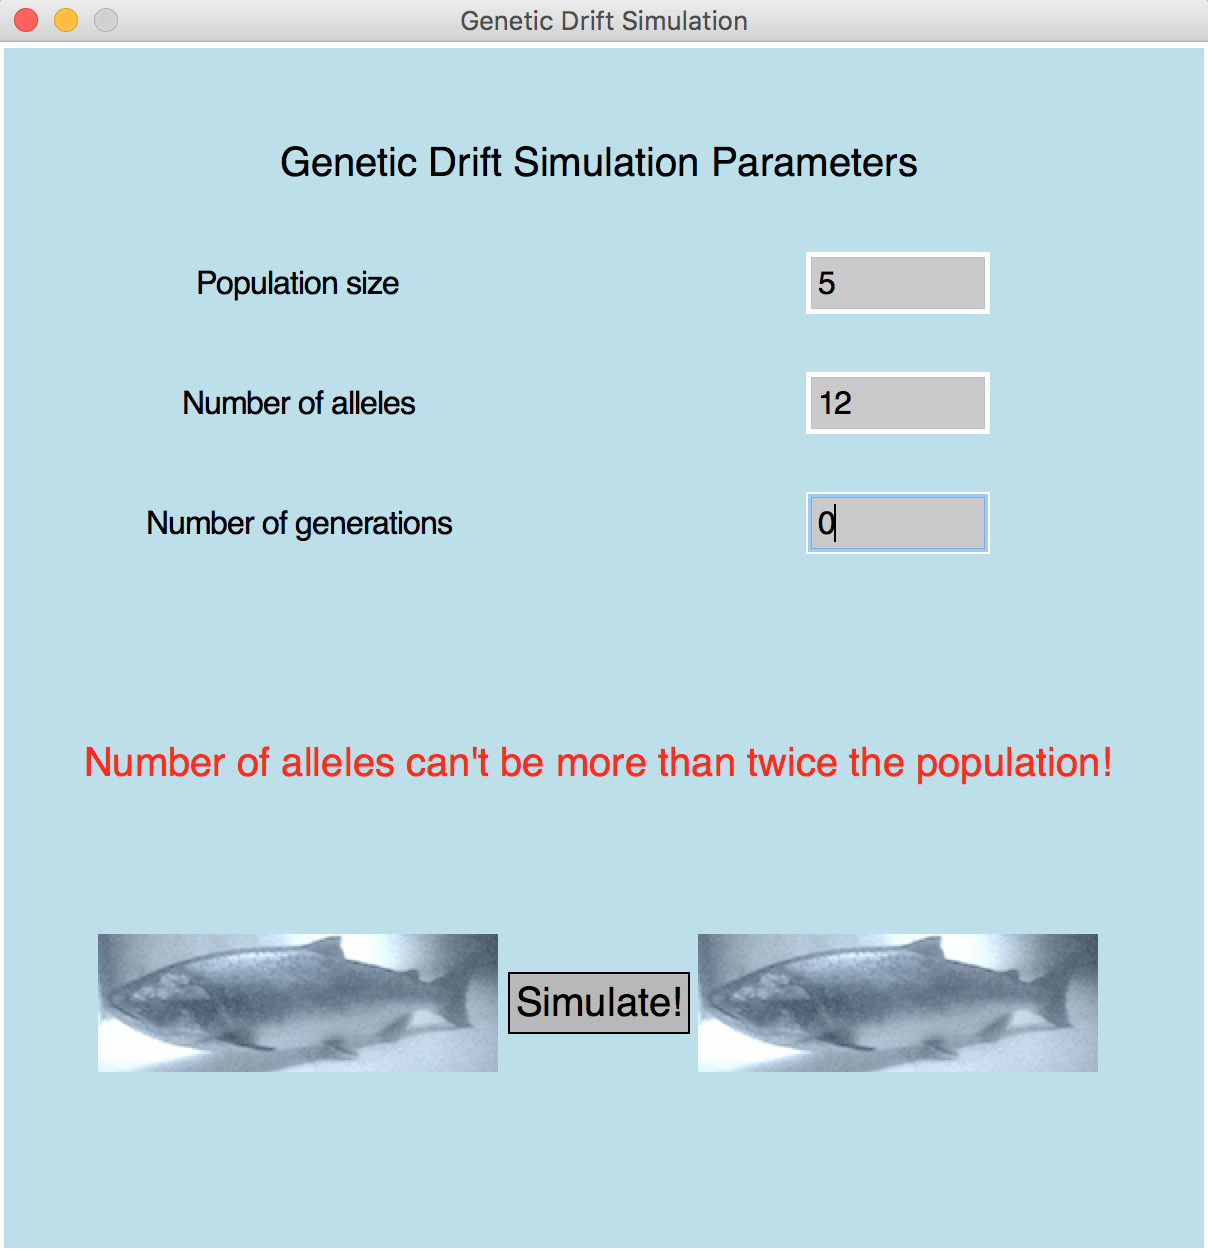
- Sample 2 (window)
Number of alleles can't be more than twice the population!
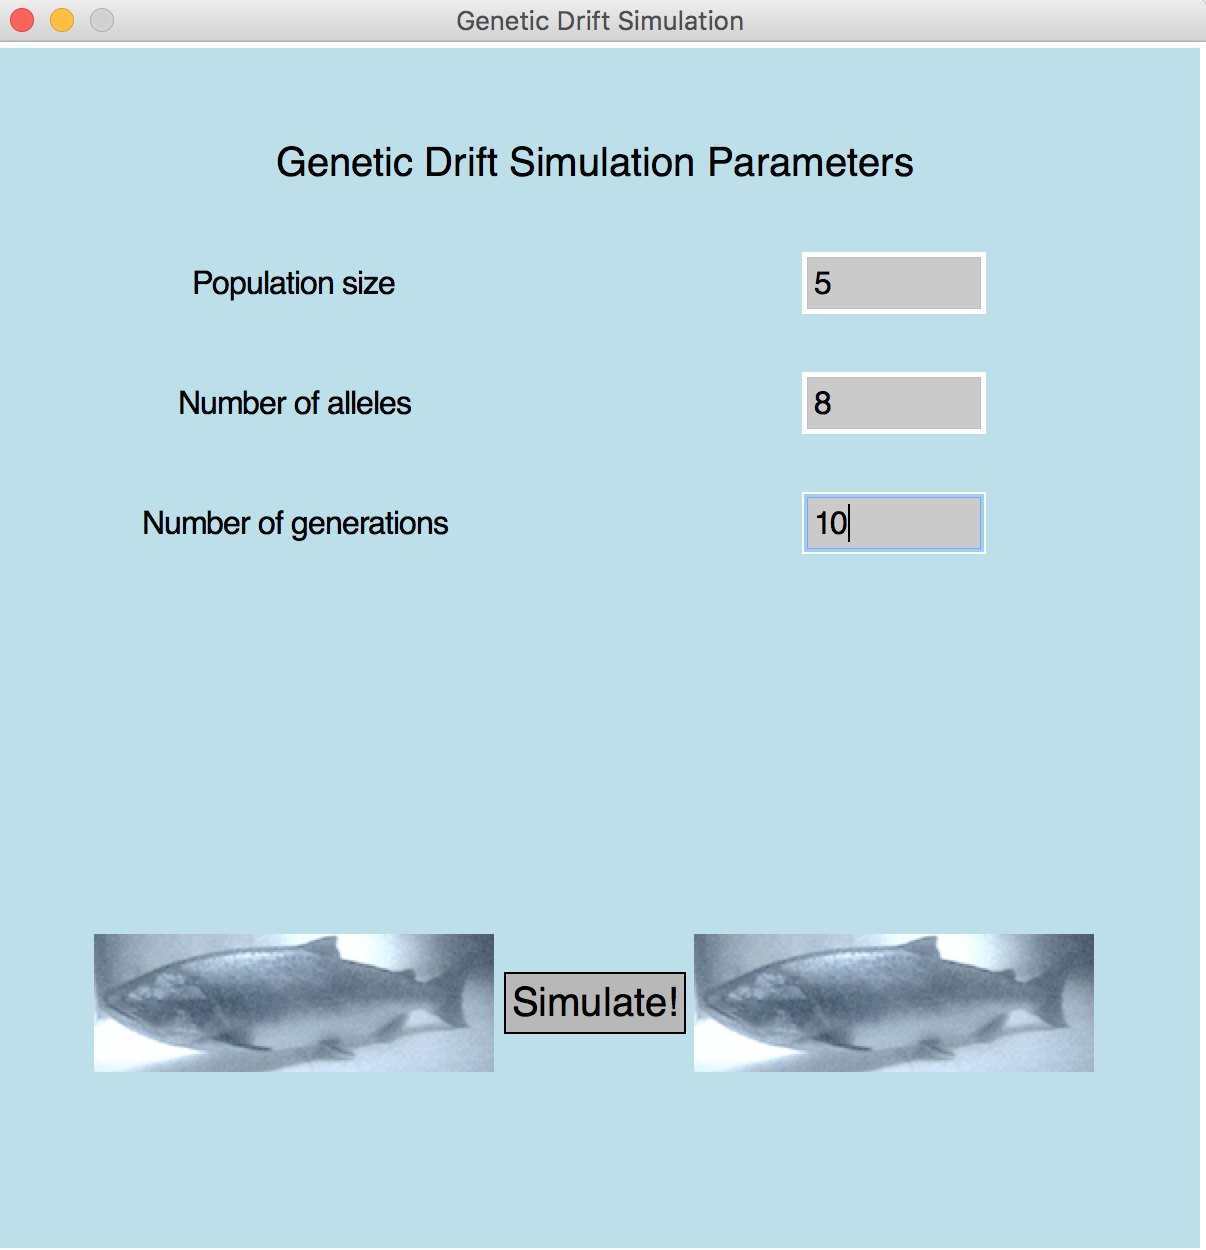
- Sample 3 (window)
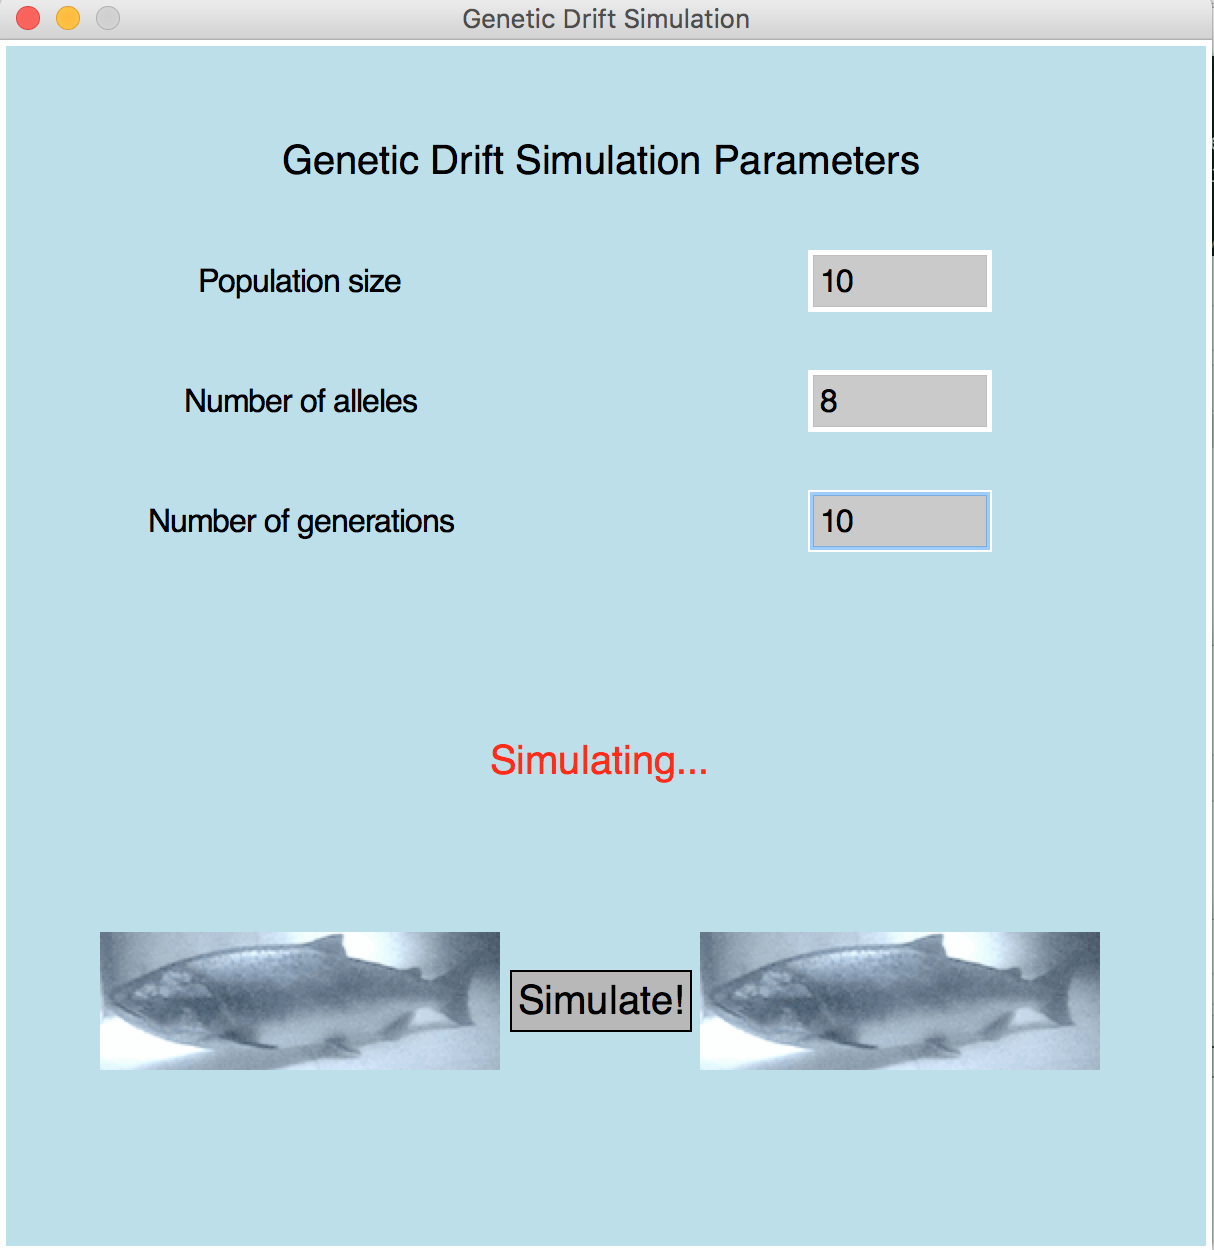
Population is 5
Number of alleles is 8
Number of generations is 10
Demo.Demo Checkpoint A.
- Download the Part B template and related support files. The template holds specifications for functions you will implement.
- Implement the
add_win()andget_simul_params()functions, by refactoring your Checkpoint A logic. The Part B template includes starter code formain(); when those two functions are properly implemented, the behavior of the code in main will match the functionality of Checkpoint A. - Now, modify
get_simul_params()to add logic that does the following:- Create a text box for the error message by calling the draw_error_msg function from drift_graphics, and then call setText to update the text. For example:
errbox = draw_error_msg(win) errbox.setText('Insert error message here') - Repeat the cycle of waiting for the user to click "Simulate!" and then checking the user's inputs and printing the error message until the user enters an error-free set of choices.
- Once that happens, you should reset the text in the error box to "Simulating..." and begin simulation as explained next.
- Here is how to simulate the number of generations specified by the user. Your eventual goal is to create a list that contains the number of distinct alleles for every generation.
- Build an initial list of alleles, with two elements for every member of the population. Assume that the
alleles are uniformly distributed. For example, if the user specified a population of 10 with 4 distinct alleles,
your list might look like this (the size of list = 2*10 = 20 and 4 distinct alleles are uniformly distributed):
[0, 1, 2, 3, 0, 1, 2, 3, 0, 1, 2, 3, 0, 1, 2, 3, 0, 1, 2, 3]
- Let us store the number of distinct alleles one by one, for each generation, in a new list. Start this list with one element corresponding to the initial generation. The value of this element should be the initial number of alleles specified by the user.
- For each subsequent generation...
- Assume that each generation is the same size as the previous generation.
- Build a list of alleles for the new generation by randomly selecting elements from the previous generation and appending them to a new list. To select a random element from a list, you can use the function random_from_list(listname) from drift_graphics, where listname is the name of your list.
- To compute the number of unique elements in your new list, use len(set(listname)). This is the number of distinct alleles in the new generation. Append this number to your list storing the number of distinct alleles in each generation.
- Print out the list that contains the number of distinct alleles for every generation. See sample output for examples.
- Build an initial list of alleles, with two elements for every member of the population. Assume that the
alleles are uniformly distributed. For example, if the user specified a population of 10 with 4 distinct alleles,
your list might look like this (the size of list = 2*10 = 20 and 4 distinct alleles are uniformly distributed):
- After simulation is complete, close the graphical window on the user's next mouse click.
- Sample 4 (Window)
- Sample 5 (Window)
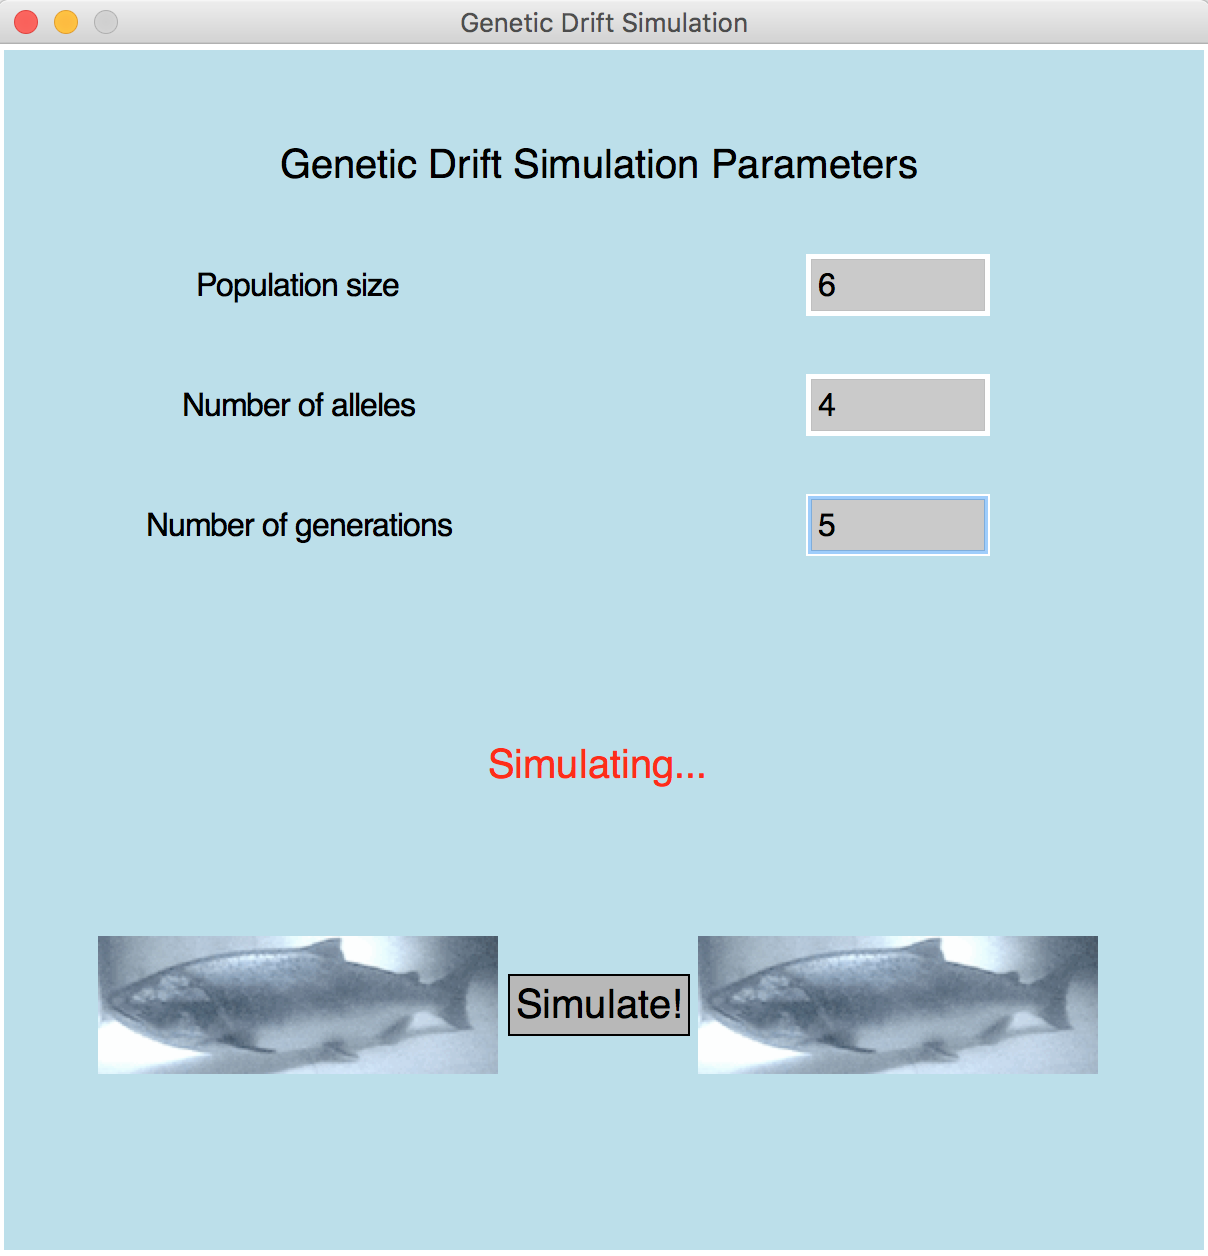
Population is 6 Number of alleles is 4 Number of generations is 5 Generation 1: [0, 1, 2, 3, 0, 1, 2, 3, 0, 1, 2, 3] Generation 2: [3, 1, 0, 2, 1, 1, 3, 2, 1, 1, 1, 0] Generation 3: [2, 1, 1, 2, 2, 0, 2, 1, 1, 2, 3, 1] Generation 4: [1, 2, 3, 1, 1, 2, 1, 2, 3, 1, 1, 2] Generation 5: [1, 1, 1, 1, 2, 1, 2, 1, 2, 1, 1, 2] Number of distinct alleles= [4, 4, 4, 3, 2]
- Sample 6 (Window)
Population is 10 Number of alleles is 8 Number of generations is 10 Generation 1: [0, 1, 2, 3, 4, 5, 6, 7, 0, 1, 2, 3, 4, 5, 6, 7, 0, 1, 2, 3] Generation 2: [7, 2, 1, 4, 3, 3, 7, 2, 2, 3, 0, 7, 0, 1, 7, 6, 7, 1, 1, 7] Generation 3: [0, 3, 2, 3, 7, 0, 7, 1, 3, 1, 2, 3, 7, 2, 6, 7, 0, 1, 0, 1] Generation 4: [6, 7, 3, 3, 3, 7, 7, 7, 3, 2, 1, 2, 0, 7, 0, 3, 1, 0, 2, 0] Generation 5: [7, 1, 6, 3, 0, 7, 1, 0, 2, 2, 3, 7, 2, 3, 2, 3, 3, 3, 3, 3] Generation 6: [7, 6, 3, 0, 7, 2, 3, 3, 3, 1, 3, 3, 1, 2, 3, 3, 3, 2, 3, 0] Generation 7: [6, 1, 7, 3, 0, 0, 2, 6, 3, 2, 1, 0, 3, 7, 6, 3, 3, 3, 7, 1] Generation 8: [3, 6, 3, 3, 1, 3, 3, 1, 3, 3, 7, 6, 2, 7, 3, 3, 2, 3, 1, 6] Generation 9: [7, 1, 7, 3, 2, 6, 1, 1, 6, 7, 3, 6, 6, 6, 3, 3, 3, 1, 6, 3] Generation 10: [6, 6, 3, 7, 6, 3, 3, 6, 6, 6, 3, 6, 3, 6, 7, 6, 3, 7, 6, 2] Number of distinct alleles= [8, 7, 6, 6, 6, 6, 6, 5, 5, 4]
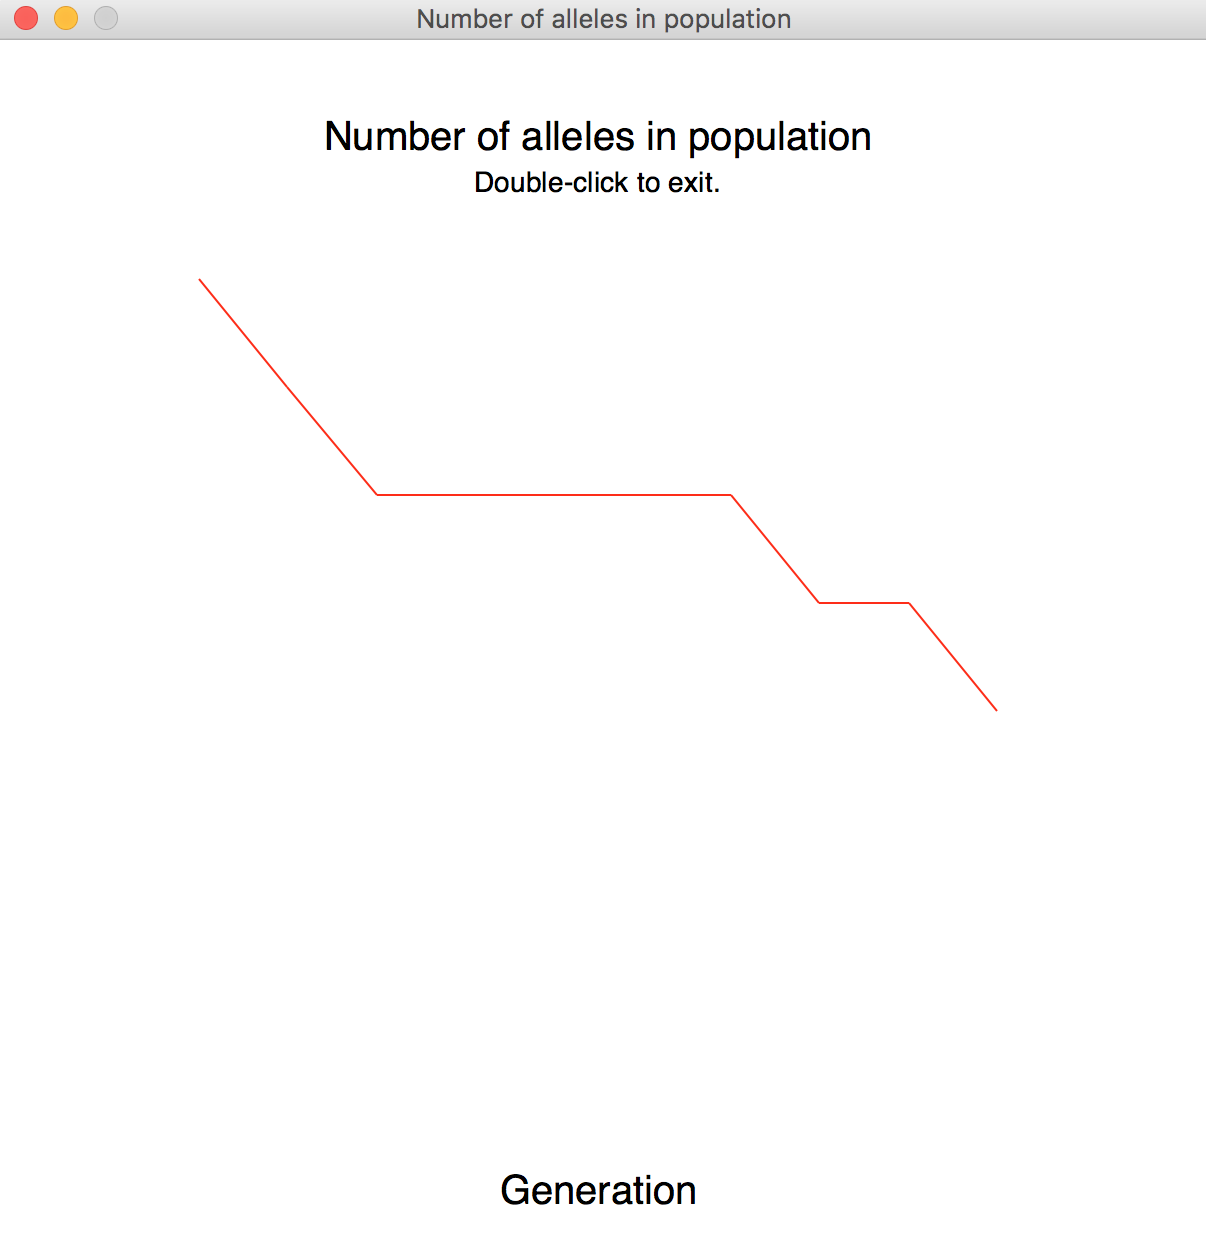
- Display a graph showing the number of distinct alleles in the population (on the y-axis) vs. the number of generations (on the x-axis).
- Compute a list containing the number of heterozygous individuals in each generation (see Summary for definition) and print it out.
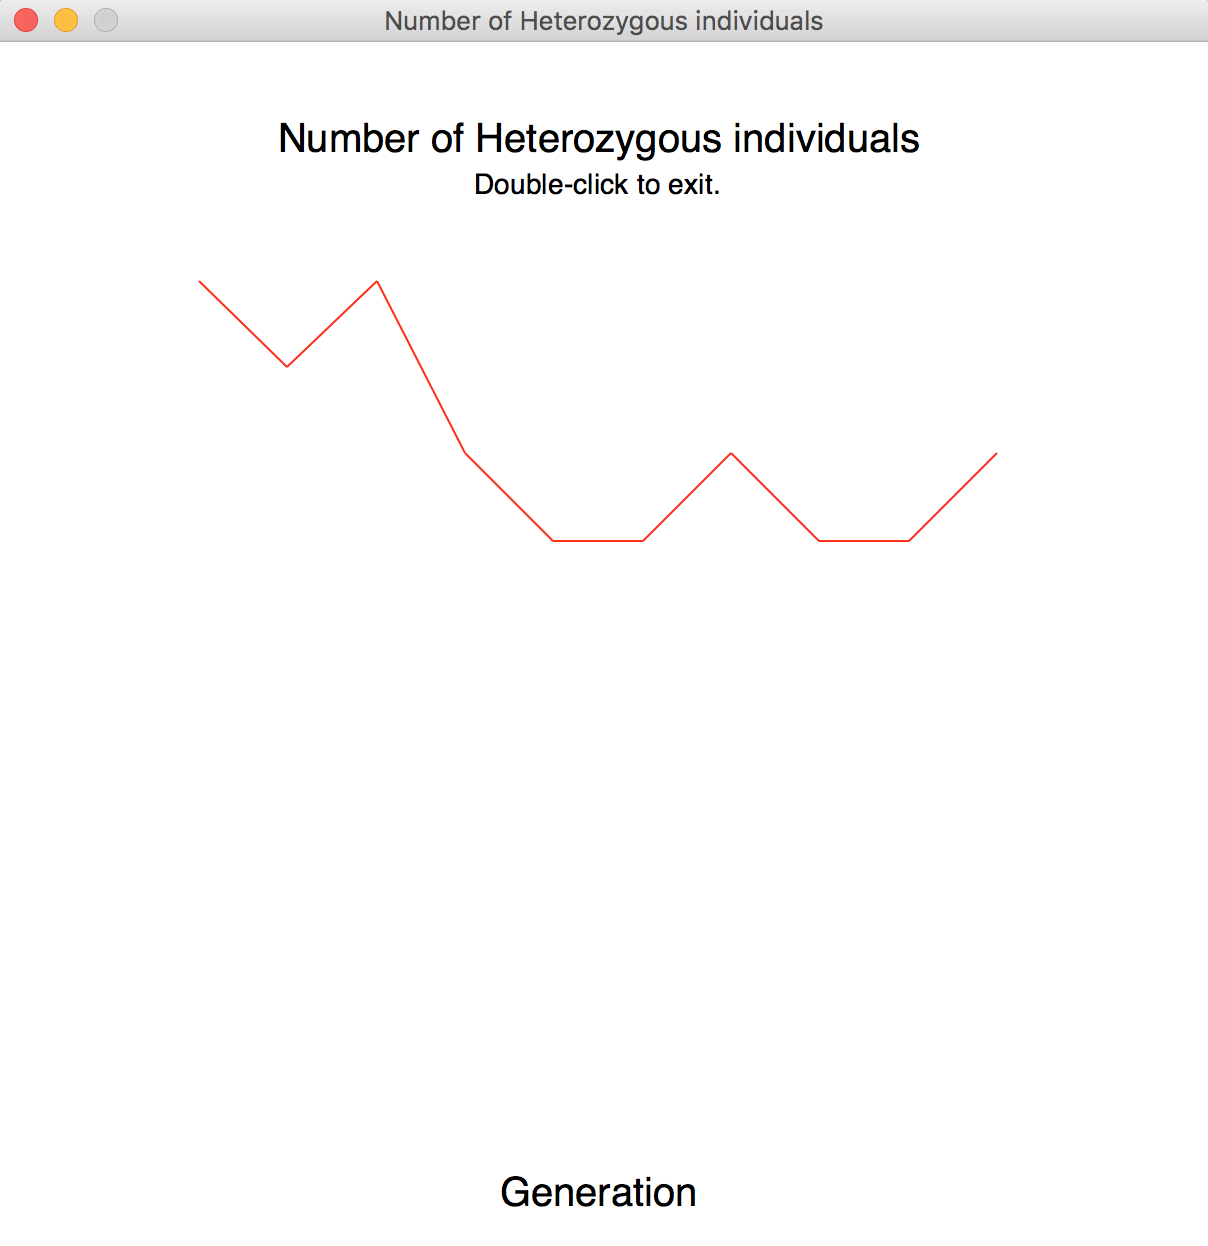
- Display a graph showing the number of heterozygous individuals in the population (on the y-axis) vs. the number of generations (on the x-axis).
- After both graphs are closed, close the graphical window showing 'Simulating..' on the user's next mouse click.
- Sample 7 (Window)
Population is 10 Number of alleles is 8 Number of generations is 10 Generation 1: [0, 1, 2, 3, 4, 5, 6, 7, 0, 1, 2, 3, 4, 5, 6, 7, 0, 1, 2, 3] Generation 2: [7, 2, 1, 4, 3, 3, 7, 2, 2, 3, 0, 7, 0, 1, 7, 6, 7, 1, 1, 7] Generation 3: [0, 3, 2, 3, 7, 0, 7, 1, 3, 1, 2, 3, 7, 2, 6, 7, 0, 1, 0, 1] Generation 4: [6, 7, 3, 3, 3, 7, 7, 7, 3, 2, 1, 2, 0, 7, 0, 3, 1, 0, 2, 0] Generation 5: [7, 1, 6, 3, 0, 7, 1, 0, 2, 2, 3, 7, 2, 3, 2, 3, 3, 3, 3, 3] Generation 6: [7, 6, 3, 0, 7, 2, 3, 3, 3, 1, 3, 3, 1, 2, 3, 3, 3, 2, 3, 0] Generation 7: [6, 1, 7, 3, 0, 0, 2, 6, 3, 2, 1, 0, 3, 7, 6, 3, 3, 3, 7, 1] Generation 8: [3, 6, 3, 3, 1, 3, 3, 1, 3, 3, 7, 6, 2, 7, 3, 3, 2, 3, 1, 6] Generation 9: [7, 1, 7, 3, 2, 6, 1, 1, 6, 7, 3, 6, 6, 6, 3, 3, 3, 1, 6, 3] Generation 10: [6, 6, 3, 7, 6, 3, 3, 6, 6, 6, 3, 6, 3, 6, 7, 6, 3, 7, 6, 2] Number of distinct alleles= [8, 7, 6, 6, 6, 6, 6, 5, 5, 4] Number of heterozygous individuals= [10, 9, 10, 8, 7, 7, 8, 7, 7, 8]
- Handle non-numeric input in each entry box.
- Write and use a new version of the graph function to draw better axis labels (write this in your own file, not in drift_graphics).
- Produce an additional graph showing the frequency of the most common allele in each generation.
- Allow the user to specify different initial frequencies for the different alleles.
- Checkpoints [20%]
-
Checkpoint demos are each worth 10 points; each is all or nothing.
- Programming Design and Style [25%]
-
In addition to being correct, your program should be easy to understand and well documented. For details, see the rubric below.
- Correctness [55%]
-
The most important part of your grade is the correctness of your final program. Your program will be tested numerous times, using different inputs, to be sure that it meets the specification. You will not get full credit for this unless your output matches the sample output exactly for every case, including capitalization and spacing. Attention to detail will pay off on this assignment. For details, see the rubric below.
- Docstring (3 points)
- There should be a docstring at the top of your submitted file with the following information:
1 pt. Your name (first and last), the course and the assignment. 2 pts. A brief description of what the program does - Use of functions (9 points)
- Program is broken up into logical, well-defined functions. Functions perform specific, well-defined jobs and have descriptive names. Functions are no more than 50 lines of code.
6 pts. Program must have student-written functions obeying above guidance. 3 pts. Functions are fully documented with a docstring confirming to our docstring conventions from class. - Documentation (6 points)
- Not counting the docstring, your program should contain at least three comments explaining aspects of your code that are potentially tricky for a person reading it to understand. You should assume that the person understands what Python syntax means but may not understand why you are doing what you are doing.
6 pts. You have at least 3 useful comments (2 points each) - Variables (3 points)
-
3 pts. Variables have helpful names that indicate what kind of information they contain. - Algorithm (4 points)
-
2 pts. Your algorithm is straightforward and easy to follow. 2 pts. Your algorithm is reasonably efficient, with no wasted computation or unused variables. - Catchall
- For students using language features that were not covered in class, up to 5 points may be taken off if the principles of programming style are not adhered to when using these features. If you have any questions about what this means, then ask.
- Copying part or all of another student's assignment
- Copying old or published solutions
- Looking at another student's code or discussing it in great detail. You will be penalized if your program matches another student's program too closely.
- Showing your code or describing your code in great detail to anyone other than the course staff or tutor.
Checkpoint B
For Checkpoint B, you will display error message on the graphical window itself and allow for user to repeatedly enter values for simulation parameters until they are error-free. Thereafter, you will simulate the number of generations specified by the user.
You need to re-design and expand your program to make use of functions, to demonstrate a program that does the following:
Advice and Hints
Hint: You may not be able to get the frequencies exactly equal. For example, here is a population of 11 with 4 distinct alleles:
[0, 1, 2, 3, 0, 1, 2, 3, 0, 1, 2, 3, 0, 1, 2, 3, 0, 1, 2, 3, 0, 1]The number of list elements (22) isn't divisible by the number of distinct alleles (4), so we did the best we could.
Hint: It is your responsibility to put appropriate logic into their own functions. The grading rubric requires that you invent and document your own functions. There are many options for this. As inspiration, one possible main() function is below, highlighting one additional function, to help you organize your own code. You may be able to infer the possible behavior of these functions from this context.
def simulateGeneticDrift(values):

    #Initialize alleles for the first generation
    ...
    print(alleles_firstgen)

    #Initialize list containing distinct alleles
    distinct_alleles = ...

    #For remaining generations
    for i in range():
        #Simulate new generation
        ...
        print(alleles_nextgen)

        #Get number of distinct alleles for this new generation and add to list distinct_alleles
        ...

    #print and return list distinct_alleles


def main():
    try:
        mywin = draw_main_window()

        list = add_win(mywin)
        values = get_simul_params(mywin, list)
        distinct_alleles = simulateGeneticDrift(values)

        mywin.getMouse()
        mywin.close()

    except GraphicsError:
        print("Hey, click on window to close it!")
If you cannot intrepret the above code, then it is a worthwhile exercise for you to think through the required behavior of the program on your own and plan out the logic using functions of your own design.
Sample Input/Output
Final Code
For final code, you will need to do the following:
To figure out the number of heterozygous individuals in a generation, recall that when we built list of alleles, there were two elements for every member of the population. This means, for each salmon, the list contains two alleles and we can assume that these are consecutive elements in the list. In other words, allele_list[0] and allele_list[1] are alleles of the first salmon, allele_list[2] and allele_list[3] are alleles of the second salmon, and so on. If the values in the pair are identical, the individual is homozygous, otherwise it is heterozygous.
To produce and display the graph, send your list of distinct alleles to the graph function from drift_graphics. By default, the graph function shows the title as "Number of alleles in population". To display the second graph, you will need to pass the list of heterozygous individuals and a new title to the graph function.
There is no demo for your final code.
Sample Input/Output

Extra Credit
There are lots of opportunities for extra credit on this assignment. Here are some examples:
Grading Rubric
Detailed Rubric
Correctness: functional features (55 points)
Therandom.seed() function in drift_graphics will be modified to simulate randomness in subsequent generations. Your program will be scored on the basis of its correct behavior under those scenarios.
| Metric 1 (5 pts): | The initial screen appears as shown in the sample (see Sample 3). |
| Metric 2 (5 pts): | Clicking outside the simulate button has no effect. |
| Metric 3 (4 pts): | Correctly identifies negative or zero population sizes and displays the error message on screen. |
| Metric 4 (5 pts): | Correctly identifies negative, zero, or too-large allele counts and displays the error message on screen (see Sample 4). |
| Metric 5 (4 pts): | Correctly identifies negative or zero generation counts and displays the error message on screen. |
| Metric 6 (5 pts): | Correctly identifies multiple errors and updates the error message accordingly. |
| Metric 7 (2 pt): | When all values are error-free, clicking the Simulate button updates the screen with "Simulating..." message (see Samples 5, 6). |
| Metric 8 (7.5 pts): | The simulation correctly print the sequence of generations and the list of distinct alleles (see Samples 5, 6). |
| Metric 9 (7.5 pts): | The simulation correctly prints the list of heterozygous individuals (see Sample 7). |
| Metric 10 (10 pts): | The simulation correctly shows the two graphs and they have the correct title (see Sample 7). |
Correctness: spacing, spelling, grammar, punctuation (5 points)
Your spelling, punctuation, etc. get a separate score: each minor error in spacing, punctuation, or spelling gets a score of 2.5, and each major error gets a score of 5. Here is how the score translates to points on the assignment:
| [5] | Score = 0 |
| -1 | 0 < Score <= 2.5 |
| -2 | 2.5 < Score <= 5 |
| -3 | 5 < Score <= 7.5 |
| -4 | 7.5 < Score <= 10 |
| -5 | Score > 10 |
Programming Design and Style (25 points)
Submission
You should submit your final code on Moodle by the deadline. I strongly encourage you to take precautions to make and manage backups while you work on your project, in case something goes wrong either while working or with your submission to Moodle.
Name the file you submit to Moodle yourlastnameP2.py, substituting your actual last name (in lowercase) for yourlastname.
Late Policies
Project late policies are outlined in the course policies page.
Collaboration Policy
Programming projects must be your own work, and academic misconduct is taken very seriously. You may discuss ideas and approaches with other students and the course staff, but you should work out all details and write up all solutions on your own. The following actions will be penalized as academic dishonesty: