Summary: In this project, you will design a graphical program to model genetic drift in Russian River salmon.
Due dates:
You will write a simulator to see how the genetic diversity of a salmon population changes over time.
For our purposes, a gene is a unit of DNA that encodes something specific. An allele is a specific form of that gene. You can think of a gene as being like a variable in programming and an allele as being like the specific value of that variable.
In organisms that reproduce sexually, like our salmon (and humans), individuals will have two copies of each gene: one from the mother, and one from the father. The two alleles (values) of these genes (variables) can be identical or different. If they are identical, the individual is homozygous for that gene. If they are different, the individual is heterozygous.
The genetic diversity of a population refers to the number of unique alleles (values) found in that population. A finite population reproducing among itself will tend to lose genetic diversity over time, which is called genetic drift.
In your program, you will design a graphical program that simulates genetic drift in a population of Russian River salmon. To start, the user will specify the number of salmon in the population, the number of unique alleles found in the initial population, and the number of generations to simulate.
You will initially assume a uniform distribution of alleles in the population. In every generation, the fish spawn (release sperm and eggs into the water). Some of the sperm and eggs will successfully join, creating the next generation of fish. To simulate this process, you will randomly sample from the population of alleles in the current generation in order to produce the next generation.
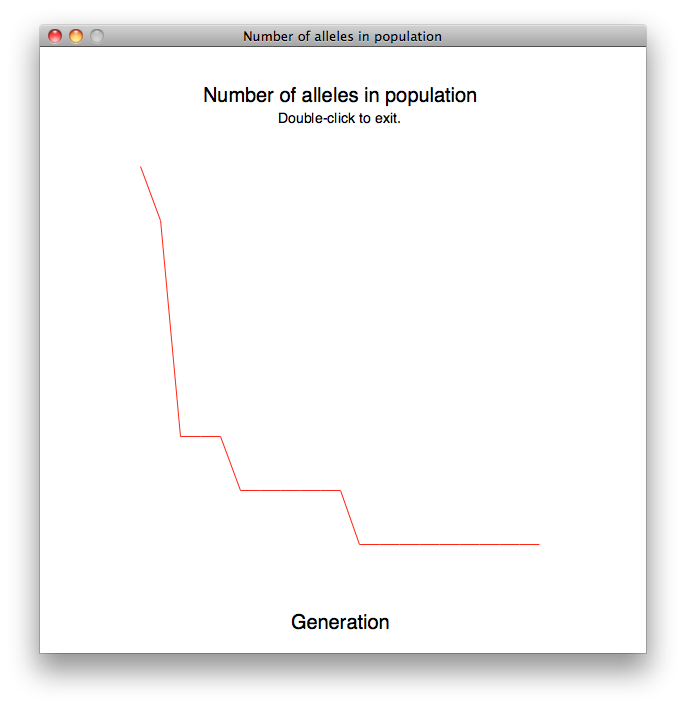
Your final product will be a graph showing the number of distinct alleles in the population (on the y-axis) vs. the number of generations (on the x-axis).
Because this project is graphical, you will have to run it locally (on either a lab computer or your personal computer). You should make sure that you download the following 3 files and place them in your default Python directory (C:\Python32 on Windows or your Documents directory on a Mac).
You will put all of your code in one file. Do not change the provided code. In your file, include the line
from drift_graphics import *
at the top. You do not need to import the regular graphics library yourself; drift_graphics does that for you.
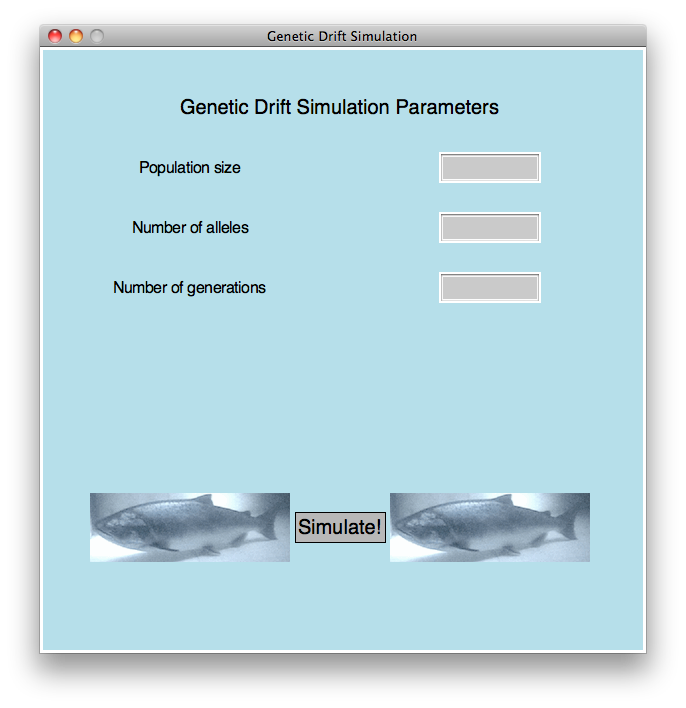
The goal of Checkpoint A is to call the functions in drift_graphics.py to create the following
window:
To draw this window successfully, you will need to call the following functions from drift_graphics.py. You should read the documentation for these functions carefully.
In addition to displaying the window as shown, your program should meet the following requirements:
You can demo Checkpoint A at the following times during the week of 10/12:
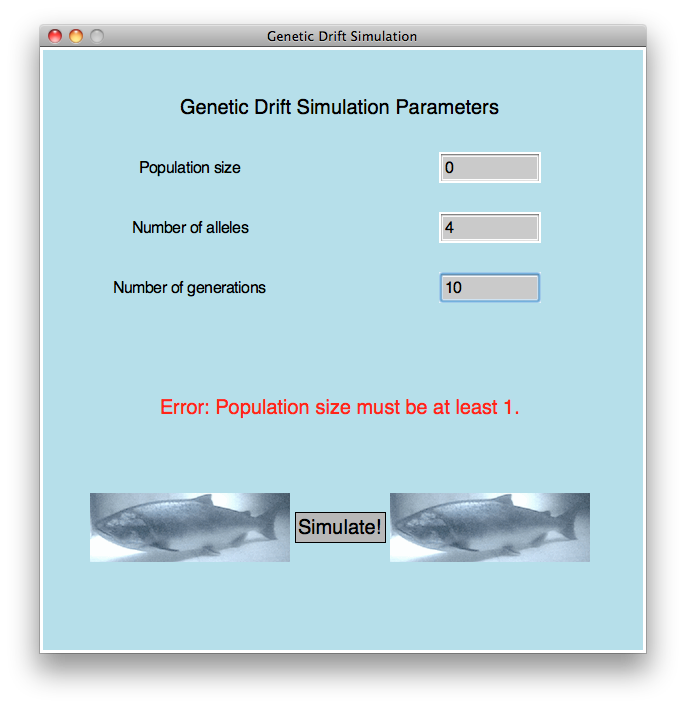
The goal of Checkpoint B is to check the user's three text inputs for errors.
Once the user has clicked the "Simulate!" button (see wait_for_button), you should use the getText() method on each element of the entry box list you created. For example:
entryboxes = draw_param_entries(...)
population = entryboxes[0].getText()
You should check the entry boxes for error in the order listed below, and display an error message for the first error you encounter. The conditions to check for are:
To display an error message graphically, you first need to create a text box for the error message by calling the draw_error_msg function from drift_graphics, and then call setText to update the text. For example:
errbox = draw_error_msg(win)
errbox.setText('You messed up.')
Of course, you should print a more specific error message than that.
Here is an example:
Your program should repeat the cycle of waiting for the user to click "Simulate!" and then checking the user's inputs and printing the error message until the user enters an error-free set of choices. Once that happens, you should reset the text in the error box to "Click once to exit" and then close the window on the user's next mouse click.
You can demo Checkpoint B at the following times during the week of 10/19:
For the final code, you will simulate the number of generations specified by the user. Your eventual goal is to create a list that contains the number of distinct alleles for every generation and use the graph function in drift_graphics.py to plot that list and see the change over time.
Here is an example. This population started with 4 individuals and 8 alleles and ran for 20 generations:
Here is how to do the simulation:
[1, 2, 3, 4, 1, 2, 3, 4, 1, 2, 3, 4, 1, 2, 3, 4, 1, 2, 3, 4]You can represent the alleles however you want. I used numbers between 1 and 4 in this example, but no one will ever see this list -- it's purely internal to your program.
[1, 2, 3, 4, 1, 2, 3, 4, 1, 2, 3, 4, 1, 2, 3, 4, 1, 2, 3, 4, 1, 2]The number of list elements (22) isn't divisible by the number of distinct alleles (4), so we did the best we could.
There are lots of opportunities for extra credit on this assignment. Here are some examples:
The most important part of your grade is the correctness of your final program.
Your program will be tested numerous times, using different inputs, to be sure that it
meets the specification. The grading rubric is posted at
cs115_p2_rubric_full.html
In addition to being correct, your program should be easy to understand and well documented.
A detailed grading sheet for this part of your project is posted at
cs115_p2_rubric_partial.html
Your checkpoints are each worth 5 points, as described above. The checkpoints cannot be submitted late.
You should submit your final code on Moodle by the deadline. As a backup, I strongly encourage you to upload a copy to your cwolf directory in case something goes wrong with your submission to Moodle.
Please name your file yourlastnameP2.py, substituting your actual last name (in lowercase) as indicated.
Programming projects must be your own work, and academic misconduct is taken very seriously. You may discuss ideas and approaches with other students and the course staff, but you should work out all details and write up all solutions on your own. The following actions will be penalized as academic dishonesty:
There is a 48-hour grace period associated with the final project deadline. This grace period is designed to cover small personal emergencies and other unexpected events. No other consideration will be given for these small emergencies.